(PTON buy price 97.00)
(PTON sell price 92.00)
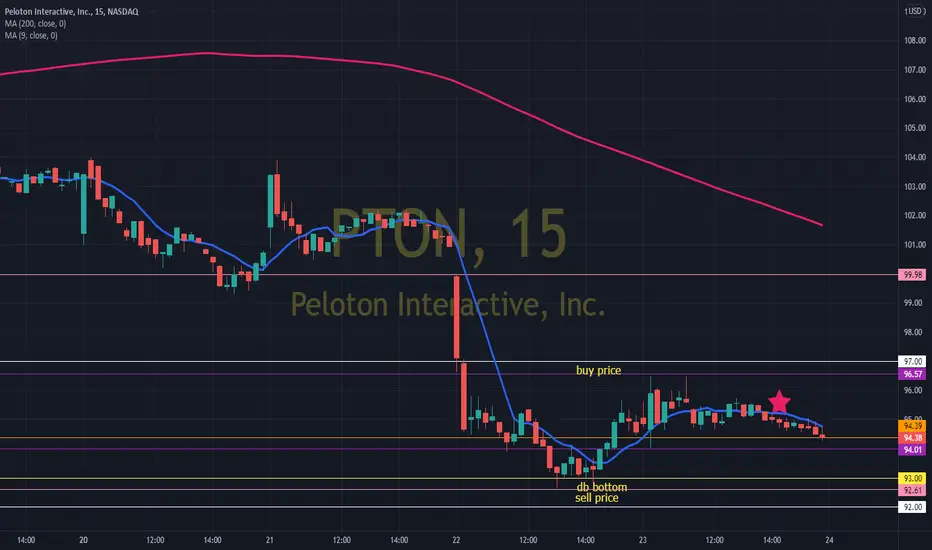
strategy: it has an inside bar on the daily chart. the bullish entry must be above the maximum of the closing candle of the daily chart 96.57 the buy price and the mv200 on the 5mn chart.
for the bearish entry: if the opening starts below the sell price and low of the closing candle on the daily chart 94.01, we expect a retest in the mean 9 or 10 period on the 5mn chart. the signal may be an inverted hammer or doji. for entry down place the stop on the previous candle.
(PTON sell price 92.00)
strategy: it has an inside bar on the daily chart. the bullish entry must be above the maximum of the closing candle of the daily chart 96.57 the buy price and the mv200 on the 5mn chart.
for the bearish entry: if the opening starts below the sell price and low of the closing candle on the daily chart 94.01, we expect a retest in the mean 9 or 10 period on the 5mn chart. the signal may be an inverted hammer or doji. for entry down place the stop on the previous candle.
Disclaimer
The information and publications are not meant to be, and do not constitute, financial, investment, trading, or other types of advice or recommendations supplied or endorsed by TradingView. Read more in the Terms of Use.
Disclaimer
The information and publications are not meant to be, and do not constitute, financial, investment, trading, or other types of advice or recommendations supplied or endorsed by TradingView. Read more in the Terms of Use.