SAGILITY INDIA LTD
Technical Analysis Overview
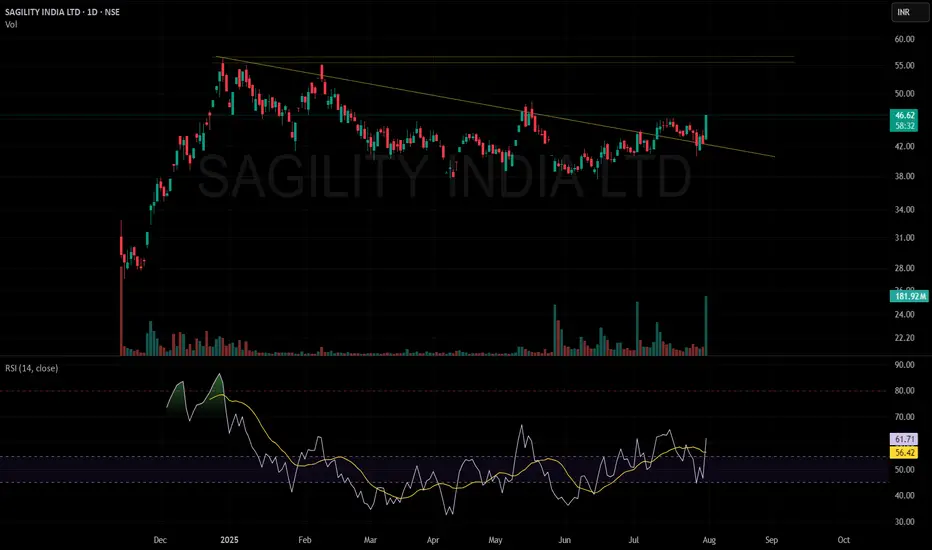
Breakout Confirmation: The stock has convincingly broken out above a long-term descending trendline, accompanied by a sharp 9.98% surge in price and a significant jump in trading volume (181.83M). This combination of price action and volume generally indicates strong bullish sentiment and marks a potential trend reversal or fresh upward leg.
Volume Analysis: The highest volume day on the chart aligns with the breakout, suggesting institutional or large participant buying. Sustained higher volumes on up days after consolidations like this often provide additional confirmation of a genuine breakout rather than a false move.
RSI Momentum: The Relative Strength Index (RSI) is at 61.71, displaying strong bullish momentum yet leaving room before entering the overbought zone (typically above 70). This suggests there may still be scope for further upside without being immediately at risk of a major reversal due to overextension.
Trend Structure: After a consolidation phase and repeated attempts at the trendline, the price has managed to close decisively above resistance, indicating that the sellers may be getting exhausted and buyers are now in control.
Strategy & Key Levels
Watch for Retest: A pullback or retest towards the breakout trendline (around the 43-44 level) could present a buying opportunity if the level holds as new support.
Next Resistance Zones: Immediate resistance can be expected at previous swing highs, notably in the 50-55 range, where the stock faced prior selling pressure.
Risk Management: Any sustained move back below the breakout trendline would warrant caution, as it could indicate a failed breakout.
Summary
This breakout, backed by strong volume and improving RSI, indicates a shift in market sentiment in favor of buyers. Keeping an eye on price action around the breakout area and monitoring volume on any pullbacks will be key to validating the strength of this move.
Technical Analysis Overview
Breakout Confirmation: The stock has convincingly broken out above a long-term descending trendline, accompanied by a sharp 9.98% surge in price and a significant jump in trading volume (181.83M). This combination of price action and volume generally indicates strong bullish sentiment and marks a potential trend reversal or fresh upward leg.
Volume Analysis: The highest volume day on the chart aligns with the breakout, suggesting institutional or large participant buying. Sustained higher volumes on up days after consolidations like this often provide additional confirmation of a genuine breakout rather than a false move.
RSI Momentum: The Relative Strength Index (RSI) is at 61.71, displaying strong bullish momentum yet leaving room before entering the overbought zone (typically above 70). This suggests there may still be scope for further upside without being immediately at risk of a major reversal due to overextension.
Trend Structure: After a consolidation phase and repeated attempts at the trendline, the price has managed to close decisively above resistance, indicating that the sellers may be getting exhausted and buyers are now in control.
Strategy & Key Levels
Watch for Retest: A pullback or retest towards the breakout trendline (around the 43-44 level) could present a buying opportunity if the level holds as new support.
Next Resistance Zones: Immediate resistance can be expected at previous swing highs, notably in the 50-55 range, where the stock faced prior selling pressure.
Risk Management: Any sustained move back below the breakout trendline would warrant caution, as it could indicate a failed breakout.
Summary
This breakout, backed by strong volume and improving RSI, indicates a shift in market sentiment in favor of buyers. Keeping an eye on price action around the breakout area and monitoring volume on any pullbacks will be key to validating the strength of this move.
Disclaimer
The information and publications are not meant to be, and do not constitute, financial, investment, trading, or other types of advice or recommendations supplied or endorsed by TradingView. Read more in the Terms of Use.
Disclaimer
The information and publications are not meant to be, and do not constitute, financial, investment, trading, or other types of advice or recommendations supplied or endorsed by TradingView. Read more in the Terms of Use.