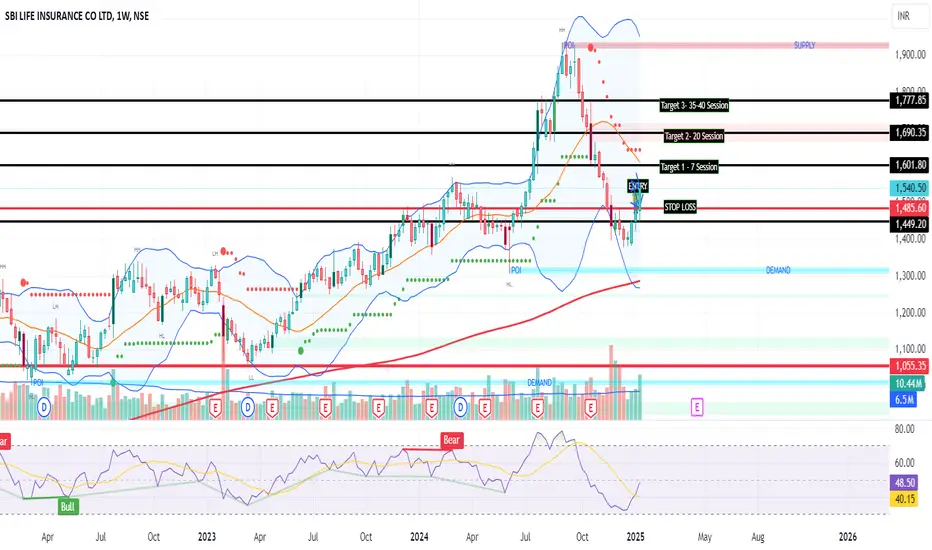
Key levels for SBI Life Insurance Company's stock as of recent data are as follows:
Support Levels:
₹1,500: A psychological support level and a recent consolidation zone.
₹1,480: A critical technical support level based on recent price action.
₹1,450: Stronger support where buyers have historically entered the market.
Resistance Levels:
₹1,560: A minor resistance level where the stock recently faced selling pressure.
₹1,600: A psychological barrier and a significant resistance level.
₹1,650: A breakout level; surpassing this could lead to bullish momentum.
Indicators to Watch:
200-Day Moving Average (₹1,490): A key long-term trend indicator.
RSI (Relative Strength Index): Overbought or oversold conditions could indicate potential reversals.
Volume Trends: Increasing volume near resistance or support levels confirms the strength of the move.
Outlook:
A breakout above ₹1,600 with strong volume could lead to a rally toward ₹1,700–₹1,750.
A drop below ₹1,480 may signal further downside toward ₹1,450 or lower.
For precise entry or exit points, technical charts and intraday trends should be analyzed.
Trade active
Keep your buying on 1448. Enter in trade with stop loss 1450. Make sure RSI on 30 Min frame would be positive rising while buying Trade closed: target reached
Disclaimer
The information and publications are not meant to be, and do not constitute, financial, investment, trading, or other types of advice or recommendations supplied or endorsed by TradingView. Read more in the Terms of Use.
Disclaimer
The information and publications are not meant to be, and do not constitute, financial, investment, trading, or other types of advice or recommendations supplied or endorsed by TradingView. Read more in the Terms of Use.