Trading Idea for SHIB/USDT (1-week Chart)
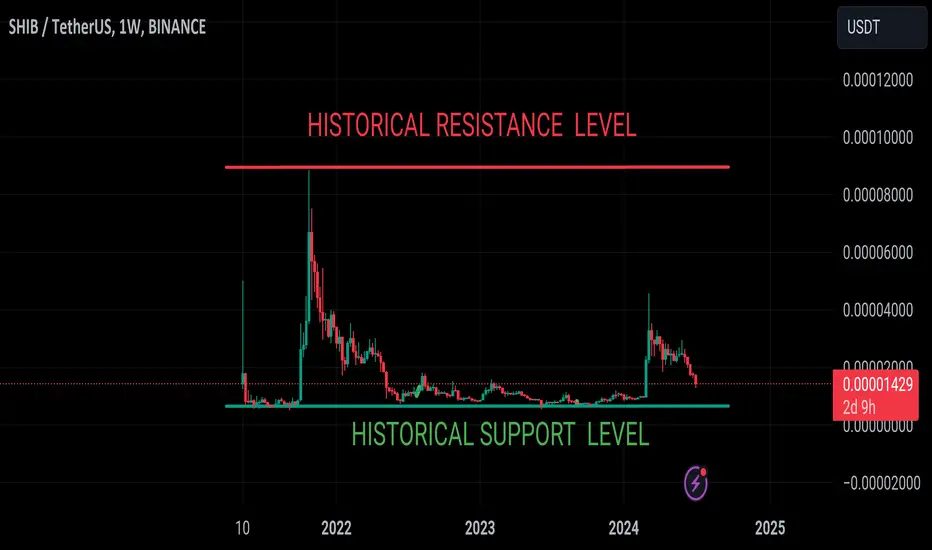
The SHIB/USDT price on the 1-week chart is currently near its historical support level around 0.00001000 USDT, after a significant downtrend from its previous highs. This suggests a potential for either a strong rebound or further decline if the support fails.
The SHIB/USDT price on the 1-week chart is currently near its historical support level around 0.00001000 USDT, after a significant downtrend from its previous highs. This suggests a potential for either a strong rebound or further decline if the support fails.
Disclaimer
The information and publications are not meant to be, and do not constitute, financial, investment, trading, or other types of advice or recommendations supplied or endorsed by TradingView. Read more in the Terms of Use.
Disclaimer
The information and publications are not meant to be, and do not constitute, financial, investment, trading, or other types of advice or recommendations supplied or endorsed by TradingView. Read more in the Terms of Use.