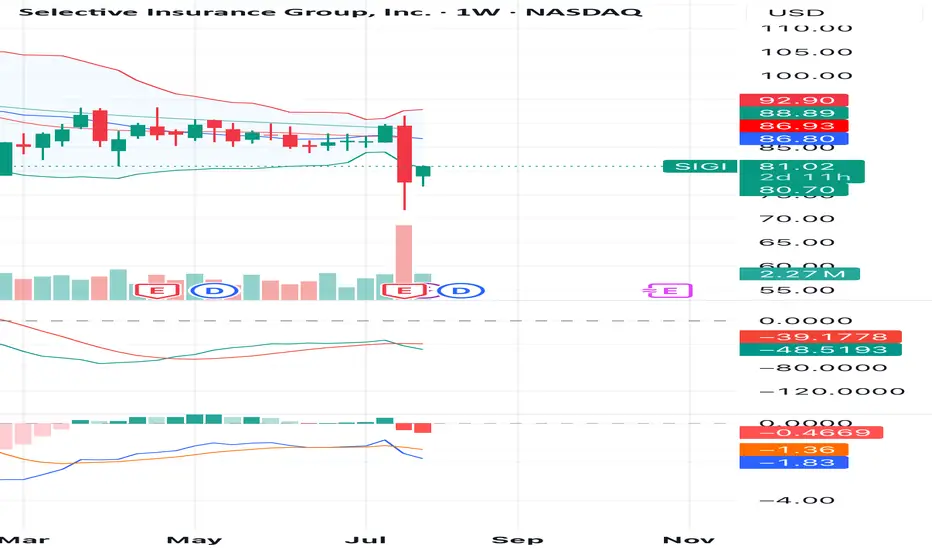
Selective Insurance Group (SIGI) is showing early signs of a potential bullish reversal after a sharp sell-off. This week, the stock has rebounded strongly from recent lows, closing above the $81 mark with increased trading volume, indicating renewed buying interest.
From a technical perspective:
• The strong bounce from support near $80 suggests that selling pressure is easing.
• Bullish volume has emerged following the recent earnings dip, showing accumulation by buyers.
• Momentum indicators (MACD & RSI) are starting to stabilize, which often precedes a short-term price recovery.
• Price is attempting to reclaim the mid-range of the Bollinger Bands, signaling potential for a push toward upper resistance levels.
Trade Idea:
• Entry: Around current levels ($81)
• Target 1: $86.90
• Target 2: $88.80
• Stop Loss: $80.70
If bullish momentum continues, we could see SIGI retesting the resistance zone around $87–$89 in the coming sessions.
Disclaimer
The information and publications are not meant to be, and do not constitute, financial, investment, trading, or other types of advice or recommendations supplied or endorsed by TradingView. Read more in the Terms of Use.
Disclaimer
The information and publications are not meant to be, and do not constitute, financial, investment, trading, or other types of advice or recommendations supplied or endorsed by TradingView. Read more in the Terms of Use.