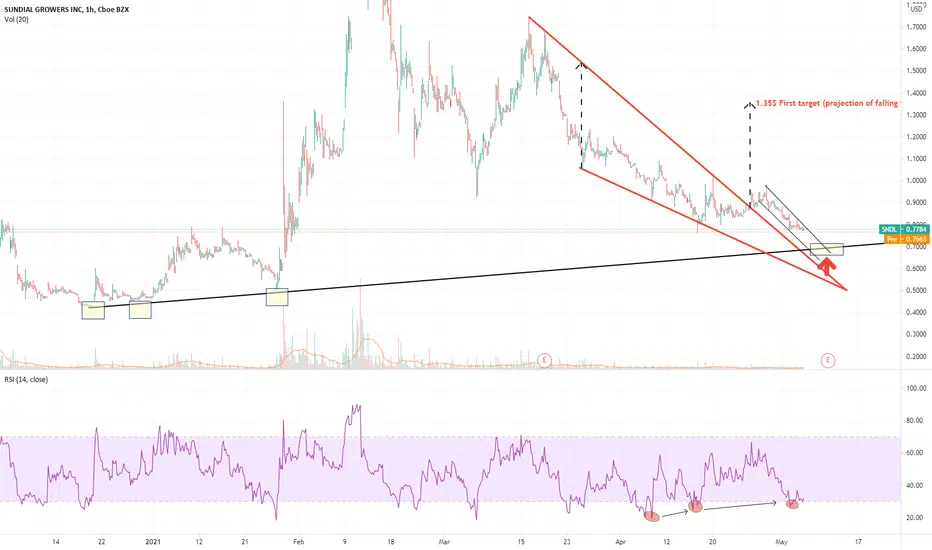
#SNDL is in my opinion very close to reverse the downtrend. Possible rebounce area at 0.7$, if not happening before. The one hour chart is showing a falling wedge being broken - with volumes - on April 27th and the price is now retracing looking for a pullback.
Very interesting to see how this bullish wedge pattern is also supported by an RSI divergence: so, basically, the RSI shows higher lows, while the prices are showing lower lows. This is pretty indicative of the fact that sellers are loosing momentum. The target of the falling wedge stands at 1.35$, but I am pretty convinced that once we reach the 1.3$ again, we'll not be seeing the bottom under 1$ anymore.
Very interesting to see how this bullish wedge pattern is also supported by an RSI divergence: so, basically, the RSI shows higher lows, while the prices are showing lower lows. This is pretty indicative of the fact that sellers are loosing momentum. The target of the falling wedge stands at 1.35$, but I am pretty convinced that once we reach the 1.3$ again, we'll not be seeing the bottom under 1$ anymore.
Trade active
The price is still at 0.7$ level, as expected. Strng support here coming from different trendlines. Moreover, RSI is confirmed to be divergent, and this is especially true in the H4 timeframe, where we are just coming out from oversold territory for the third time since April 16thDisclaimer
The information and publications are not meant to be, and do not constitute, financial, investment, trading, or other types of advice or recommendations supplied or endorsed by TradingView. Read more in the Terms of Use.
Disclaimer
The information and publications are not meant to be, and do not constitute, financial, investment, trading, or other types of advice or recommendations supplied or endorsed by TradingView. Read more in the Terms of Use.