Macro to Micro Context
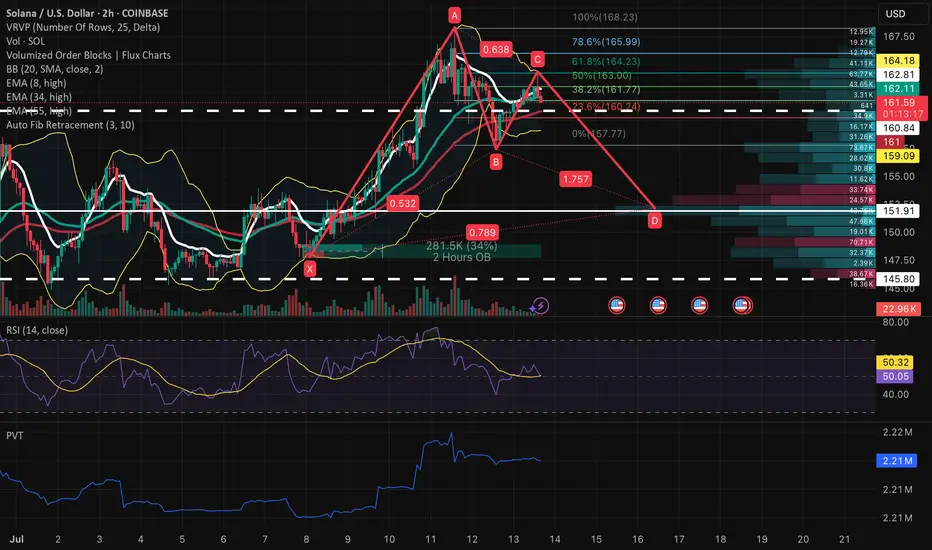
SOL is currently reacting off a short-term distribution zone between 164 and 168 after an impulsive run-up from early July. While no complete harmonic has printed yet, the structure forming resembles a potential Bearish Gartley. The CD leg shown is not yet confirmed, but represents a projected path derived from the local point of value and volume geometry on the 2H chart. The area between 157 and 152 remains the primary zone of interest, given historical demand and high-volume node alignment.
Structural and Momentum Breakdown
XABCD Estimate:
XA was impulsive, AB retraced 53.2%, and BC retraced 63.8% of AB
CD projection is speculative, drawn from the confluence of the BC extension (1.757), 0.786 retrace of XA, and the local value zone around 157.5–152
Volume Profile: Substantial volume shelf aligns with projected CD completion. Above 164, volume thins out sharply, indicating inefficiency and risk of rejection
Order Blocks: 2H bullish OB from July 1–3 sits directly inside the 157–152 range, adding further structural validity to this projected leg
Momentum Signals:
RSI is stalling below mid-band (50–60), suggesting loss of buyer momentum
Price Volume Trend (PVT) shows deceleration post-surge, potentially preceding distribution
Bollinger Bands are compressing, which often leads to volatility re-expansion following trend exhaustion
Trade Plan
At this stage, the CD leg remains a hypothesis based on value structure and harmonic geometry. The trade plan focuses on preparing for potential long entries if price moves into the estimated completion zone with supportive signals.
Watch Zone for Long Setup: 157.5 to 152.5
Invalidation: Clean break below 147 suggests breakdown and invalidates harmonic idea
Take-Profit Targets on Reversal:
TP1: 161.5 to 163.0
TP2: 165.5 to 168.0
Required Confirmation:
Bullish divergence on RSI or PVT bounce
Reclaim of 2H order block zone with impulse and follow-through
Disclaimer
The information and publications are not meant to be, and do not constitute, financial, investment, trading, or other types of advice or recommendations supplied or endorsed by TradingView. Read more in the Terms of Use.
Disclaimer
The information and publications are not meant to be, and do not constitute, financial, investment, trading, or other types of advice or recommendations supplied or endorsed by TradingView. Read more in the Terms of Use.