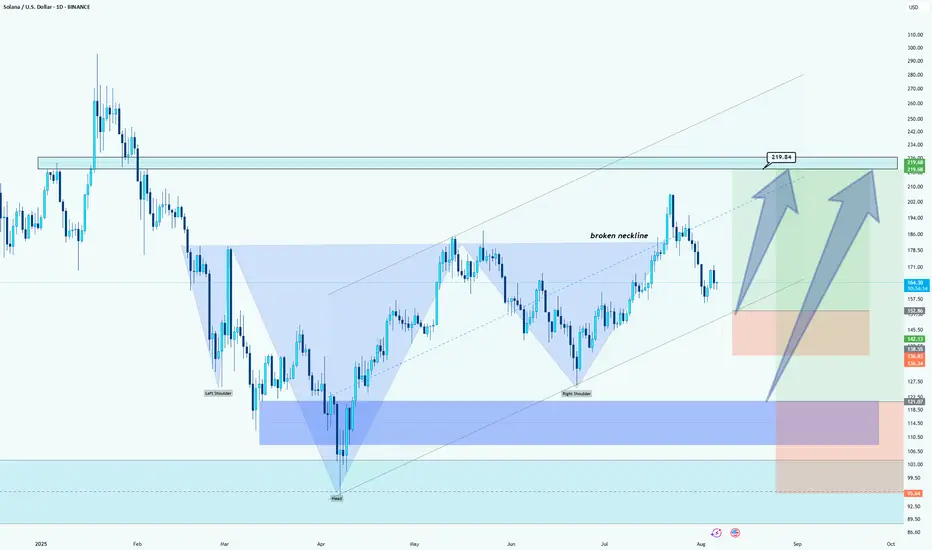
What I see:
Given the broken neckline and the formation of the Head and Shoulders pattern, the bullish scenario appears more likely. A price target of around $219.84 seems feasible if the upward momentum continues. However, if the price fails to hold above the neckline or reverses, the support zones could provide areas for potential price bounces, with the $136.34 region as a significant level to watch for possible buying opportunities. Therefore, the most probable outcome aligns with the bullish scenario (towards $219.84).
- Chart Patterns (Head and Shoulders): The chart illustrates a classic "Head and Shoulders" pattern. The left shoulder, head, and right shoulder are formed, and the neckline (the blue dashed line) has been broken, which suggests that the price could rise towards the target zone above the broken neckline.
- Target Price: Based on the pattern and technical analysis, the potential target for the price could be around $219.84, as indicated by the box in the upper right corner. This target aligns with the upward trend continuation from the broken neckline.
- Support Zones: There are several key support levels below the current price, including the lower zone marked in blue around $95.50 and the potential demand area in the middle blue zone (around $136.34). These could act as areas for price to rebound from if there's a pullback.
- Trend Line and Movement: The dotted blue trend line suggests an ascending trend, showing higher lows, and the price is likely to continue upward after the recent breakout above the neckline.
Given the broken neckline and the formation of the Head and Shoulders pattern, the bullish scenario appears more likely. A price target of around $219.84 seems feasible if the upward momentum continues. However, if the price fails to hold above the neckline or reverses, the support zones could provide areas for potential price bounces, with the $136.34 region as a significant level to watch for possible buying opportunities. Therefore, the most probable outcome aligns with the bullish scenario (towards $219.84).
👉 My recommended broker: bit.ly/HYMCMELI
____
Telegram channel: t.me/melikatrader94
Forex telegram channel: t.me/melikatrader94GoldForex
____
Telegram channel: t.me/melikatrader94
Forex telegram channel: t.me/melikatrader94GoldForex
Related publications
Disclaimer
The information and publications are not meant to be, and do not constitute, financial, investment, trading, or other types of advice or recommendations supplied or endorsed by TradingView. Read more in the Terms of Use.