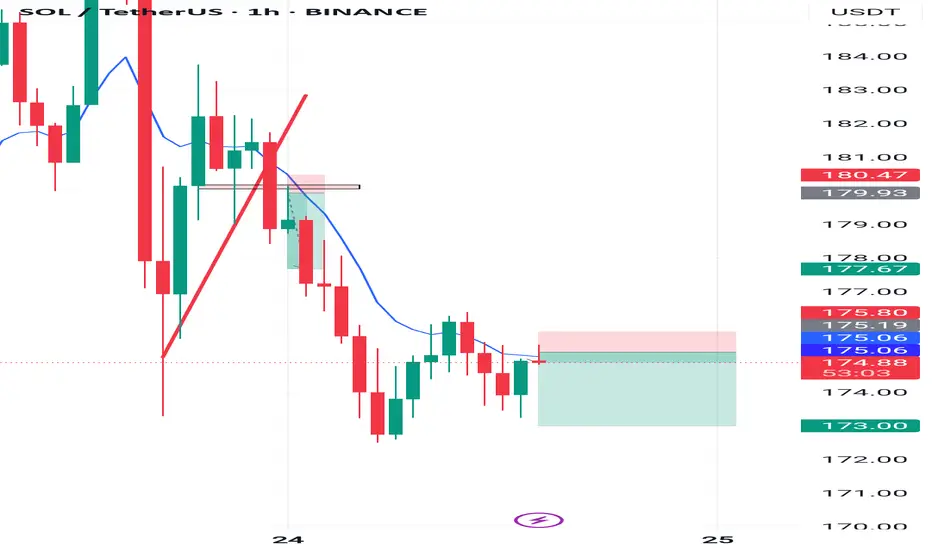
This is a 1-hour chart of SOL/USDT (Solana vs Tether) on TradingView. Here's a breakdown of the technical analysis visible:
Trade Setup Overview:
Current Price: ~$175.05
Entry Point: Around 175.09 (marked by blue horizontal line and entry candle)
Stop Loss (SL): Around 175.80 (red zone above the entry)
Take Profit (TP): Around 173.00 (green zone below the entry)
Chart Analysis:
1. Trend:
Recent price action shows a strong downward trend, with consecutive bearish candles.
Price tried to break above the 9-period EMA (blue line), but it's acting as dynamic resistance.
2. Entry Logic:
The trade is a short/sell position.
Entry was likely made after a bearish rejection from the EMA or minor structure resistance.
Trader expects price to drop further towards the 173.00 level.
3. Risk-to-Reward Ratio (RRR):
SL is small (~0.7 points above), TP is large (~2 points below), suggesting a good RRR (approx. 1:3).
That’s a positive sign for proper risk management.
4. Bearish Confirmation:
The green candle that hit the EMA and then showed weakness might be a signal of rejection, confirming bearish sentiment continuation.
5. Key Levels:
Resistance: 175.80 – 177.67 zone
Support: 173.00 zone (target)
Disclaimer
The information and publications are not meant to be, and do not constitute, financial, investment, trading, or other types of advice or recommendations supplied or endorsed by TradingView. Read more in the Terms of Use.
Disclaimer
The information and publications are not meant to be, and do not constitute, financial, investment, trading, or other types of advice or recommendations supplied or endorsed by TradingView. Read more in the Terms of Use.