Dear Tradingview family,
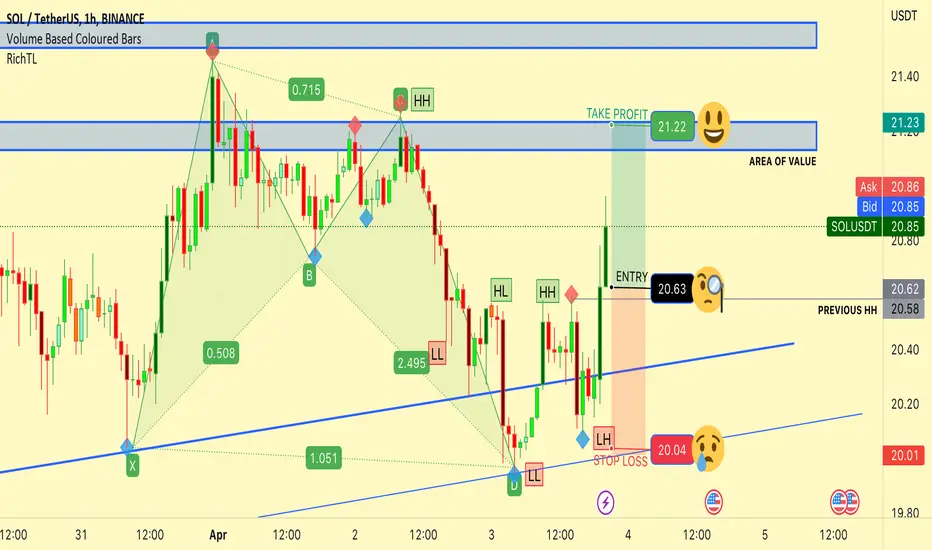
Symbol: #SOL_USDT
Strategy: #HARMONIC_CHART_PATTERN #Trend_REVERSAL #Trendline #Support_Resistance
Indicators: #Price_Action. #Chart_patterns HARMONIC_CHART_PATTERNS, #Trendline #Support_Resistance #RSI #RichTL
Anchor Time: 4 Hours
Trading Time Frame: 1 Hours.
Trade Call Type: #LONG.
Order Type: BUY STOP
Entry: BUY when Price breaks previous Higher High
Entry price: 20.62
Take Profit: 21.23
Stop Loss: 20.01
RRR- 1:1
Methodology:
As a professional and experienced forex, crypto and stocks trader, I will be using a rigorous methodology that involves analyzing the price action and key levels and using a combination of indicators, harmonic chart patterns and chart patterns. I will be looking for potential trendlines , support & resistance levels where the price action may reverse and using our indicators to confirm the validity of our analysis. Based on my analysis, I will then determine the optimal entry and exit points for our trade, as well as the appropriate stop loss level to manage risk.
Conclusion:
Based on our analysis, I believe that there is a potential trading opportunity for a LONG trade.
Risk Assessment:
Conservative Traders risk 0.5% to 1.5%, moderator traders risk 1.6% to 3.5% and aggressive traders risk 3.6% to 5% of their account per trade.
Please use Position size calculator to calculate your risk per trade.
"London-Based Trader | Certified Technical Analyst | Intraday & Scalping Specialist 📈📊 #Forex #Commodities #Indices #Crypto"
Disclaimer
The information and publications are not meant to be, and do not constitute, financial, investment, trading, or other types of advice or recommendations supplied or endorsed by TradingView. Read more in the Terms of Use.