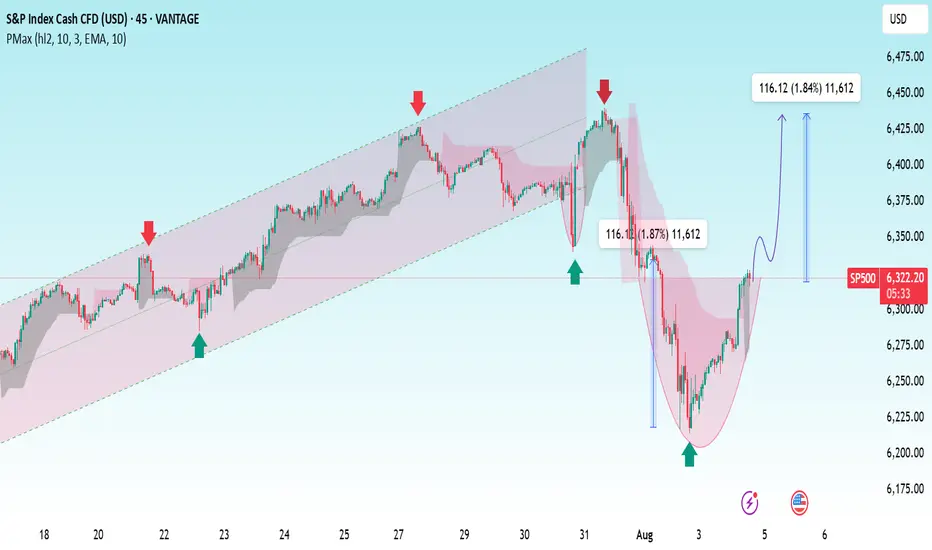
This 45-minute chart of the S&P 500 Index (SP500) shows a bullish "cup and handle" formation emerging after a sharp pullback. The price action rebounded from the lower trendline of the rising channel, forming a rounded bottom pattern. If confirmed, the projected breakout target is around 6,425–6,435, implying a 1.84% potential upside (116.12 points). Previous red and green arrows indicate key reversal points within the channel, with the latest green arrow suggesting strong buying support. Momentum appears to be shifting bullishly, setting the stage for a potential continuation to new highs.
🔍 Technical Analysis
1. Trend Structure:
The price had been moving within an ascending channel, indicating a medium-term uptrend.
Recent price action broke below the channel briefly but has now rebounded, hinting at a potential false breakdown and bullish continuation.
2. Chart Pattern:
A Cup and Handle formation is clearly identified:
Cup: The rounded bottom between July 31 and August 3 shows consolidation and base building.
Handle (forming): Slight pullback or sideways movement expected before a breakout.
This is a classic bullish continuation pattern, suggesting upside momentum.
3. Target Projection:
The chart shows a measured move target of:
+116.12 points
+1.84% upside
Projected target zone: ~6,425 to 6,435
4. Support and Resistance Levels:
Support: Around 6,200 (recent low and base of the cup)
Immediate Resistance: Near 6,350–6,360 (handle breakout zone)
Target Resistance: Near 6,425–6,435
5. PMax Indicator (EMA-Based):
The shaded bands suggest trend support and resistance zones.
Currently, the price is re-entering the bullish zone, which strengthens the bullish case.
---
📈 Bullish Signals
Strong bounce from recent lows forming a rounded reversal.
Pattern breakout potential (cup and handle).
Reclaiming momentum and trend structure after a short-term dip.
Buyer interest seen at the bottom of the channel (green arrows).
⚠ Bearish Risks
If price fails to break above 6,350, the handle could invalidate.
Failure to hold above 6,275–6,300 could invite further downside.
Market sentiment/news or macro data could override technicals.
---
📊 Conclusion
The S&P 500 on the 45-min chart shows signs of recovery and potential bullish continuation after a well-defined cup and handle formation. A breakout above the handle resistance (~6,350) could see price rally toward the 6,425–6,435 target area. Risk management remains key, especially if the handle fails to confirm or external catalysts emerge.
Trade active
Clean charts | 🔍 Deep analysis | 📈 Consistent setups”
MY FREE FOREX &CRYPTO SIGNALS TELEGRAM CHANNEL:
t.me/+4KSkqllbBldiZDY8
MY FREE FOREX &CRYPTO SIGNALS TELEGRAM CHANNEL:
t.me/+4KSkqllbBldiZDY8
Related publications
Disclaimer
The information and publications are not meant to be, and do not constitute, financial, investment, trading, or other types of advice or recommendations supplied or endorsed by TradingView. Read more in the Terms of Use.