🔬 SPX – A Long-Term Perspective
Before we dive into the usual weekly analysis, let’s zoom out. I took a look at SPX from a less conventional angle, using a 6-hour chart that spans the past year.

Notice how neatly SPX has been respecting a red parallel downward channel over the past months. Just for fun, I cloned this channel and aligned it with the ATH to form a mirrored structure — and surprisingly, it fits.
This isn’t a prediction, just a theoretical construction — but it’s worth noting that despite extreme bearish sentiment weeks ago, SPX has been grinding higher under very low VIX levels.
The green dotted line could represent an upper boundary where a correction becomes increasingly likely. SPX has already burned through all prior resistance zones, and only the ~6000 level remains as a potential exhaustion zone in this structure.
A reminder to occasionally take a step back before we zoom in too close.
📈 Weekly SPX GEX Outlook
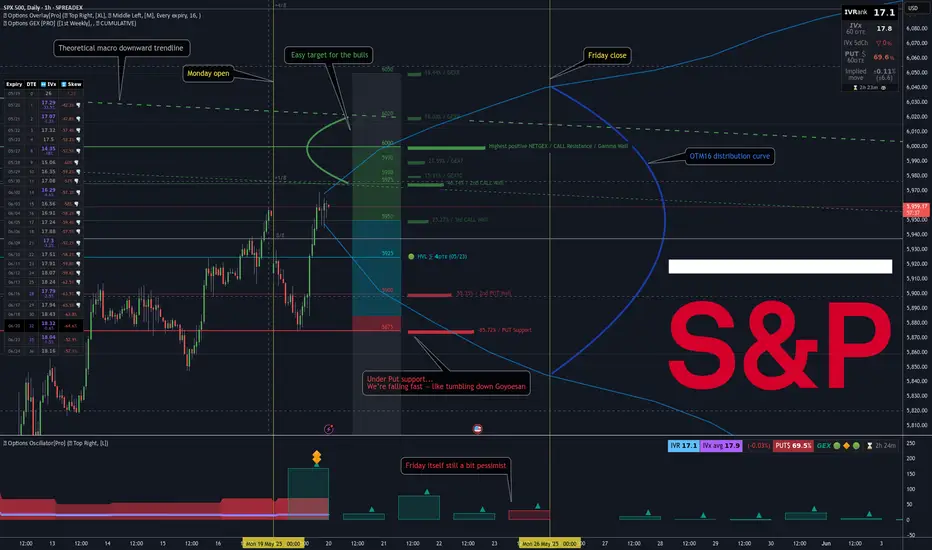
Let’s turn our Tanuki Options indicators back on — I feel blind without them 😅 — and focus only on this week’s SPX GEX outlook.

Note: I left the theoretical upper bound of the descending channel on the chart for reference.
That said, even strong trends need pauses — and structurally, SPX is reaching areas where a pullback makes sense, technically speaking.
📍 Spot price at time of analysis: 5963
The Options Overlay blue OTM16 distribution curve for the week spans the 5840–6040 range. Within this, we can observe the GEX levels — the strikes around which market participants are currently positioned and hedged.
📉 Although the price briefly touched the weekly put support (5875) after Monday's open, it quickly bounced back.
The 5885–5925 range, as expected from a well-defined lightblue transition zone, is capable of absorbing price on one side and rejecting it from the other — exactly what happened today.
🔼 We are now in positive GEX territory, above the HVL cluster, and sitting near strikes that currently appear supportive through Friday — all the way up to 6000.
As such, there doesn’t appear to be much resistance up to the 6000 level. With a bit of a positive gamma squeeze, we could even push toward 6020.
𝗕𝗲𝗹𝗼𝘄 𝟱𝟴𝟳𝟱 𝘁𝗵𝗲𝗿𝗲’𝘀 𝗯𝗮𝘀𝗶𝗰𝗮𝗹𝗹𝘆 𝗮 𝘃𝗮𝗰𝘂𝘂𝗺 — 𝘃𝗲𝗿𝘆 𝗹𝗶𝘁𝘁𝗹𝗲 𝘀𝘂𝗽𝗽𝗼𝗿𝘁.
That’s worth thinking about. Had the put support not held today, we could have easily dropped to 5800, which might have triggered another downside cascade — a negative gamma squeeze.
✅ 𝗖𝗼𝗻𝗰𝗹𝘂𝘀𝗶𝗼𝗻 — 𝗛𝗼𝘄 𝗜’𝗺 𝘂𝘀𝗶𝗻𝗴 𝘁𝗵𝗶𝘀 𝗶𝗻𝗳𝗼𝗿𝗺𝗮𝘁𝗶𝗼𝗻 𝗿𝗶𝗴𝗵𝘁 𝗻𝗼𝘄:
With positive GEX and the call resistance + squeeze zone still within a reasonable reach, I currently have no reason to be anything but bullish for the week in terms of sentiment.
BUT — if we do push up into the 6000–6020 range, I definitely want to buy some cheap downside hedge — just in case any negative news hits and the bullish breakout fails to hold.
🛡️ If you haven’t hedged your positions yet, now might be a good time to consider it.
💡 What’s the cheapest way to hedge?
Take a quick look at your portfolio or any longer-term trades and check your net delta exposure.
A/ If you're heavily positive delta:
You may want to consider short-dated downside protection, such as:
– A far OTM single-leg put, or (if that’s too expensive – VIX is only 18...)
– A put debit spread as a cheaper alternative.
B/ If you’re net short or bearish:
You might consider the opposite:
– A short-dated OTM call or call spread to protect against an upside surprise.
These are low-cost ways to prepare for binary risk events, especially when you know they’re coming.
🧠 What’s the point of hedging anyway?
The logic is simple:
If the market moves in your favor, you still profit — and the hedge cost is your only loss, a small price to pay for peace of mind.
Your total net portfolio gain will still exceed the cost of the hedge.
👉 But if the market goes against you, a proper hedge can dramatically reduce losses.
And in that moment... you'll be very glad you protected yourself.
⚖️ Stay smart. Manage your risk.
P.S.: This isn’t a signal — it’s just smart risk management worth considering. 🧩
Before we dive into the usual weekly analysis, let’s zoom out. I took a look at SPX from a less conventional angle, using a 6-hour chart that spans the past year.
Notice how neatly SPX has been respecting a red parallel downward channel over the past months. Just for fun, I cloned this channel and aligned it with the ATH to form a mirrored structure — and surprisingly, it fits.
This isn’t a prediction, just a theoretical construction — but it’s worth noting that despite extreme bearish sentiment weeks ago, SPX has been grinding higher under very low VIX levels.
The green dotted line could represent an upper boundary where a correction becomes increasingly likely. SPX has already burned through all prior resistance zones, and only the ~6000 level remains as a potential exhaustion zone in this structure.
A reminder to occasionally take a step back before we zoom in too close.
📈 Weekly SPX GEX Outlook
Let’s turn our Tanuki Options indicators back on — I feel blind without them 😅 — and focus only on this week’s SPX GEX outlook.
Note: I left the theoretical upper bound of the descending channel on the chart for reference.
That said, even strong trends need pauses — and structurally, SPX is reaching areas where a pullback makes sense, technically speaking.
📍 Spot price at time of analysis: 5963
The Options Overlay blue OTM16 distribution curve for the week spans the 5840–6040 range. Within this, we can observe the GEX levels — the strikes around which market participants are currently positioned and hedged.
📉 Although the price briefly touched the weekly put support (5875) after Monday's open, it quickly bounced back.
The 5885–5925 range, as expected from a well-defined lightblue transition zone, is capable of absorbing price on one side and rejecting it from the other — exactly what happened today.
🔼 We are now in positive GEX territory, above the HVL cluster, and sitting near strikes that currently appear supportive through Friday — all the way up to 6000.
As such, there doesn’t appear to be much resistance up to the 6000 level. With a bit of a positive gamma squeeze, we could even push toward 6020.
𝗕𝗲𝗹𝗼𝘄 𝟱𝟴𝟳𝟱 𝘁𝗵𝗲𝗿𝗲’𝘀 𝗯𝗮𝘀𝗶𝗰𝗮𝗹𝗹𝘆 𝗮 𝘃𝗮𝗰𝘂𝘂𝗺 — 𝘃𝗲𝗿𝘆 𝗹𝗶𝘁𝘁𝗹𝗲 𝘀𝘂𝗽𝗽𝗼𝗿𝘁.
That’s worth thinking about. Had the put support not held today, we could have easily dropped to 5800, which might have triggered another downside cascade — a negative gamma squeeze.
✅ 𝗖𝗼𝗻𝗰𝗹𝘂𝘀𝗶𝗼𝗻 — 𝗛𝗼𝘄 𝗜’𝗺 𝘂𝘀𝗶𝗻𝗴 𝘁𝗵𝗶𝘀 𝗶𝗻𝗳𝗼𝗿𝗺𝗮𝘁𝗶𝗼𝗻 𝗿𝗶𝗴𝗵𝘁 𝗻𝗼𝘄:
With positive GEX and the call resistance + squeeze zone still within a reasonable reach, I currently have no reason to be anything but bullish for the week in terms of sentiment.
BUT — if we do push up into the 6000–6020 range, I definitely want to buy some cheap downside hedge — just in case any negative news hits and the bullish breakout fails to hold.
🛡️ If you haven’t hedged your positions yet, now might be a good time to consider it.
💡 What’s the cheapest way to hedge?
Take a quick look at your portfolio or any longer-term trades and check your net delta exposure.
A/ If you're heavily positive delta:
You may want to consider short-dated downside protection, such as:
– A far OTM single-leg put, or (if that’s too expensive – VIX is only 18...)
– A put debit spread as a cheaper alternative.
B/ If you’re net short or bearish:
You might consider the opposite:
– A short-dated OTM call or call spread to protect against an upside surprise.
These are low-cost ways to prepare for binary risk events, especially when you know they’re coming.
🧠 What’s the point of hedging anyway?
The logic is simple:
If the market moves in your favor, you still profit — and the hedge cost is your only loss, a small price to pay for peace of mind.
Your total net portfolio gain will still exceed the cost of the hedge.
👉 But if the market goes against you, a proper hedge can dramatically reduce losses.
And in that moment... you'll be very glad you protected yourself.
⚖️ Stay smart. Manage your risk.
P.S.: This isn’t a signal — it’s just smart risk management worth considering. 🧩
Boost up your charts with Options PRO!
REAL Options metrics for over 200+ liquid US symbols:
✔ 𝗔𝘂𝘁𝗼-𝗨𝗽𝗱𝗮𝘁𝗶𝗻𝗴 𝗚𝗘𝗫 𝗹𝗲𝘃𝗲𝗹𝘀
✔ GEX ✔ IVRank ✔ CALL/PUT skew ✔ Volatility✔ Delta curves
👉 7-day TRIAL 🌐 TanukiTrade.com
REAL Options metrics for over 200+ liquid US symbols:
✔ 𝗔𝘂𝘁𝗼-𝗨𝗽𝗱𝗮𝘁𝗶𝗻𝗴 𝗚𝗘𝗫 𝗹𝗲𝘃𝗲𝗹𝘀
✔ GEX ✔ IVRank ✔ CALL/PUT skew ✔ Volatility✔ Delta curves
👉 7-day TRIAL 🌐 TanukiTrade.com
Related publications
Disclaimer
The information and publications are not meant to be, and do not constitute, financial, investment, trading, or other types of advice or recommendations supplied or endorsed by TradingView. Read more in the Terms of Use.