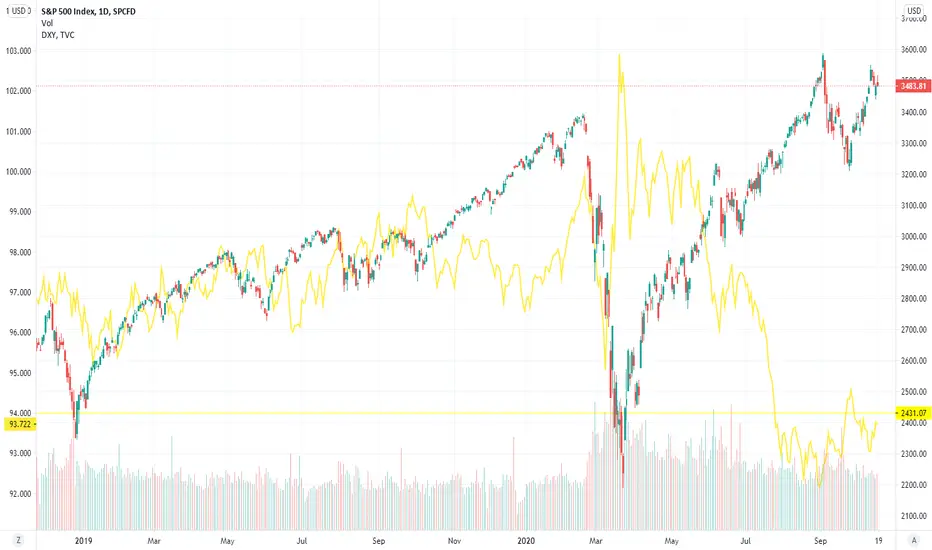
From the chart, you can see the SPX500 chart in green and red candles and the US dollar index (DXY) in yellow lines.
1. You can take a look at the strong negative correlation between the SPX500 and the US dollar index, especially before the US election(from September to November) to see why it's important to take notice at the DXY before the election.
2. I personally will pay attention to the yellow level——94 of DXY. If DXY goes above 94, it may be a good opportunity to go short.
3.Why? As far as I'm concerned, the markets usually become full of uncertainty before the US election. Investors may tend to exit the market when the uncertainty increases and transfer their stocks, crypto into money or bonds. So the DXY, as well as VIX is a strong negative correlation index to watch for chances to short the stock market.
Disclaimer
The information and publications are not meant to be, and do not constitute, financial, investment, trading, or other types of advice or recommendations supplied or endorsed by TradingView. Read more in the Terms of Use.
Disclaimer
The information and publications are not meant to be, and do not constitute, financial, investment, trading, or other types of advice or recommendations supplied or endorsed by TradingView. Read more in the Terms of Use.