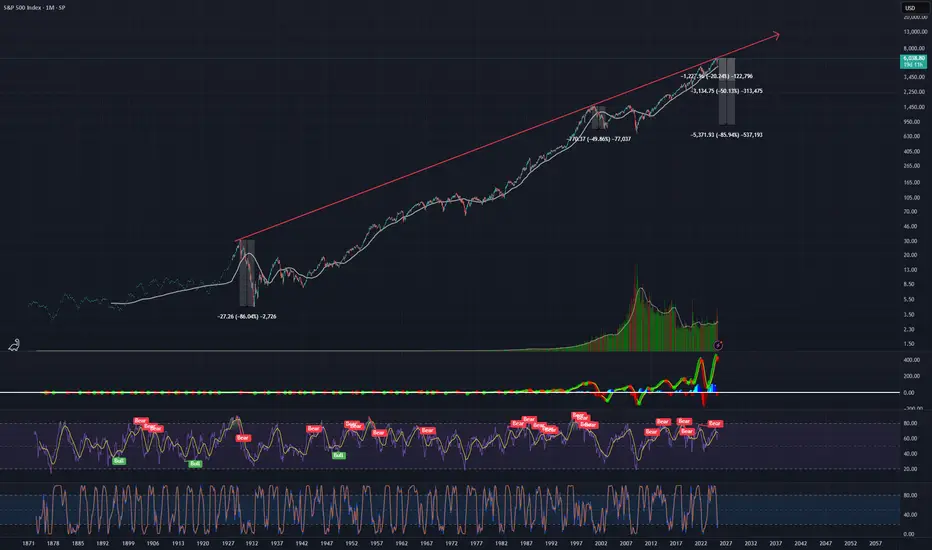
Log chart of SPX with a trendline connecting 1929 top to 2000 dot com top and up to 2024-25 top.
We already touched this trendline multiple times at the end of 2024 and the beggining of 2025, after which we saw a 20ish percent pullback.
If history rhymes, then we can expect a top at 6250-6350 area in the next few months and we might even stay around there for some time trapping retail investors and other foverever bulls. However, the crash ranging beteween 50 percent (2000 dot com bubble burst) and 86 percent (1929 Wall Street crash) might unravel over the next few years.
With the amount of leverage in the market this house of cards can tumble down even quicker.
Take care.
Disclaimer
The information and publications are not meant to be, and do not constitute, financial, investment, trading, or other types of advice or recommendations supplied or endorsed by TradingView. Read more in the Terms of Use.
Disclaimer
The information and publications are not meant to be, and do not constitute, financial, investment, trading, or other types of advice or recommendations supplied or endorsed by TradingView. Read more in the Terms of Use.