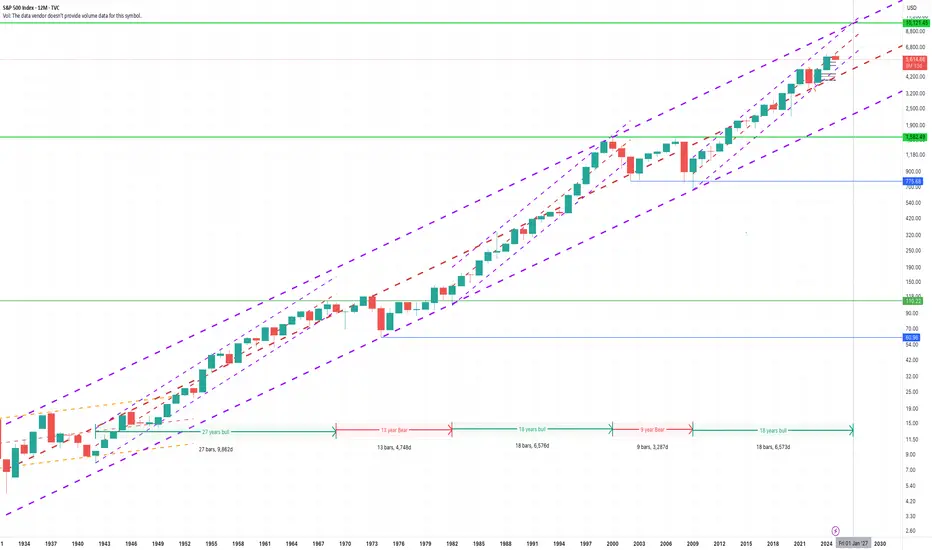
This chart shows the cyclical nature of the global economy, S&P500.
There is a clear correlation between a Bull supercycle and a 50% correction afterwards, which lasts for half the period of the supercycle.
First SuperCycle had a 27 years long growth, then 13.5 years correction.
Second SuperCycle had 18 years long growth and 9 years long correction.
Current SuperCycle ends in 2027 technically.
It is reasonable to sell your assets in 2026, at least 50% of all your portfolio.
Disclaimer
The information and publications are not meant to be, and do not constitute, financial, investment, trading, or other types of advice or recommendations supplied or endorsed by TradingView. Read more in the Terms of Use.
Disclaimer
The information and publications are not meant to be, and do not constitute, financial, investment, trading, or other types of advice or recommendations supplied or endorsed by TradingView. Read more in the Terms of Use.