With oil prices firming and the market experiencing significant intraday selling, it’s obvious there are deep and growing concerns about corporate earnings, the economy and, to a lesser extent, a firming Yen.
Earnings are expected to decline 9% yoy in 1Q and the Atlanta Fed “nowcast” model forecast for real GDP growth (seasonally adjusted annual rate) in the first quarter of 2016 is 0.1 percent.
My thinking has changed slightly, believing the correction will be sooner than later and, possibly, deeper. I think first target, though, is the 200DMA.
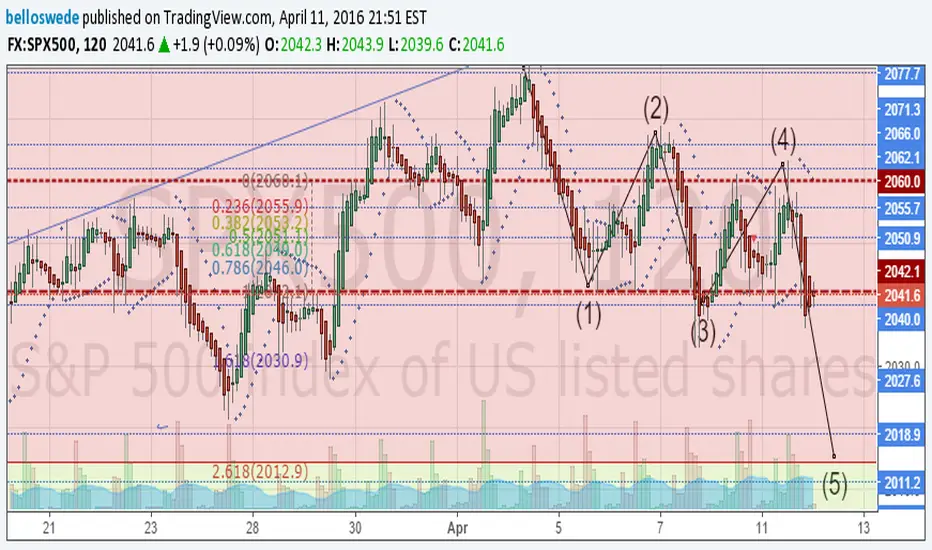
The chart is fairly self explanatory but I will add that that Elliot waves were the only means of connecting all the dots, explaining recent price behavior and directional bias.
The dashed horizontal lines define where the market has spent most of its time, as measured by volume, in recent days. It’s approximately 14 points in height and a common Fib extension would suggest the market could easily slip down to the 2013 area which is also home to the 200 DMA presently at 2014
The other point of confluence is the big picture retracement levels with the 23.6% level conveniently located at 2014. So, I think its just a question of time before we visit the 200DMA
Earnings are expected to decline 9% yoy in 1Q and the Atlanta Fed “nowcast” model forecast for real GDP growth (seasonally adjusted annual rate) in the first quarter of 2016 is 0.1 percent.
My thinking has changed slightly, believing the correction will be sooner than later and, possibly, deeper. I think first target, though, is the 200DMA.
The chart is fairly self explanatory but I will add that that Elliot waves were the only means of connecting all the dots, explaining recent price behavior and directional bias.
The dashed horizontal lines define where the market has spent most of its time, as measured by volume, in recent days. It’s approximately 14 points in height and a common Fib extension would suggest the market could easily slip down to the 2013 area which is also home to the 200 DMA presently at 2014
The other point of confluence is the big picture retracement levels with the 23.6% level conveniently located at 2014. So, I think its just a question of time before we visit the 200DMA
Disclaimer
The information and publications are not meant to be, and do not constitute, financial, investment, trading, or other types of advice or recommendations supplied or endorsed by TradingView. Read more in the Terms of Use.
Disclaimer
The information and publications are not meant to be, and do not constitute, financial, investment, trading, or other types of advice or recommendations supplied or endorsed by TradingView. Read more in the Terms of Use.