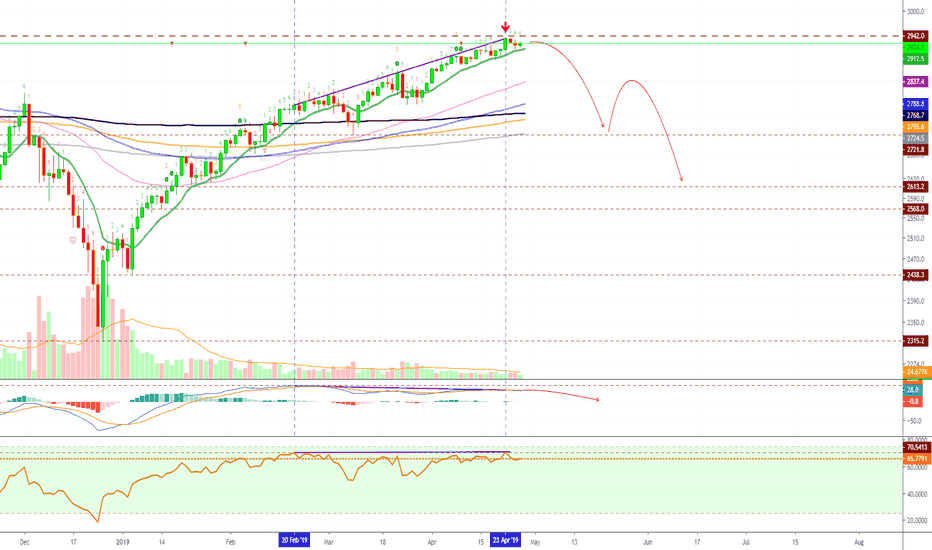
You could say we got the S&P 500 (SPX) charts completely wrong, or you could say we saw this one coming, that is completely up to you, you can check our previous analysis here: 
In the analysis above, you can see that we mention the price moving to the all-time high before dropping as a potential scenario but the less likely one, this one is now the true scenario.
Just like it happens with cryptocurrency, the market moved differently to what most analysts expected, but what will happen next?
The charts and signals are still quite bearish for the S&P 500 (SPX). So yes, it is moving up slowly but a drop will be coming sooner rather than later... Let's take a look at these signals together now, while you hit the like button (thumbs up)... Thanks a lot for the continued support.
S&P 500 Chart Analysis by Alan Masters
These are the main signals coming from the chart. Even though we have the SPX slowly increasing in price, the signals are developing to the bearish side, this is an indication that this index can easily drop.
Conditions for change: The SPX is near its all-time high, so it should be very easy to track here. If the all-time high is broken and volume grows, then you can expect this bullish trend to continue. But if the SPX remains below ATH, then the possibilities of an upcoming drop increases dramatically.
What's your take on the S&P 500 and the signals mentioned above?
Please share your thoughts in the comments section below.
Thanks a lot for reading.
This is Alan Masters, and I appreciate your continued support.
Namaste.

In the analysis above, you can see that we mention the price moving to the all-time high before dropping as a potential scenario but the less likely one, this one is now the true scenario.
Just like it happens with cryptocurrency, the market moved differently to what most analysts expected, but what will happen next?
The charts and signals are still quite bearish for the S&P 500 (SPX). So yes, it is moving up slowly but a drop will be coming sooner rather than later... Let's take a look at these signals together now, while you hit the like button (thumbs up)... Thanks a lot for the continued support.
S&P 500 Chart Analysis by Alan Masters
- The first signal we are looking at is a double top. We can see that the SPX hit all-time high 2942 on the week of the 17th September 2018, I shared a chart right after that. You can see it here:

- Trading volume is at its lowest in years. You would expect volume increasing on the way up, but that is not true. Trading volume is really low, this supports an upcoming drop.
- The MACD is showing clear bearish divergence which is only growing stronger by the week, see it here:
- The RSI is also on the same situation. Moving up but with bearish divergence growing.
- The chart pattern drawn in purple is a classic Rising Wedge, this pattern is bearish in nature and can lead to a breakdown.
These are the main signals coming from the chart. Even though we have the SPX slowly increasing in price, the signals are developing to the bearish side, this is an indication that this index can easily drop.
Conditions for change: The SPX is near its all-time high, so it should be very easy to track here. If the all-time high is broken and volume grows, then you can expect this bullish trend to continue. But if the SPX remains below ATH, then the possibilities of an upcoming drop increases dramatically.
What's your take on the S&P 500 and the signals mentioned above?
Please share your thoughts in the comments section below.
Thanks a lot for reading.
This is Alan Masters, and I appreciate your continued support.
Namaste.
🚨 TOP FREE Trades
ETH +1450% · AAVE +1134%
XRP +749% · DOGS +868%
BTC +563% · SOL +658%
t.me/anandatrades/1350
🚨 FREE Analyses & New Results
t.me/masteranandatrades/6499
🚨 PREMIUM LIFETIME (Since 2017)
lamatrades.com
ETH +1450% · AAVE +1134%
XRP +749% · DOGS +868%
BTC +563% · SOL +658%
t.me/anandatrades/1350
🚨 FREE Analyses & New Results
t.me/masteranandatrades/6499
🚨 PREMIUM LIFETIME (Since 2017)
lamatrades.com
Related publications
Disclaimer
The information and publications are not meant to be, and do not constitute, financial, investment, trading, or other types of advice or recommendations supplied or endorsed by TradingView. Read more in the Terms of Use.

