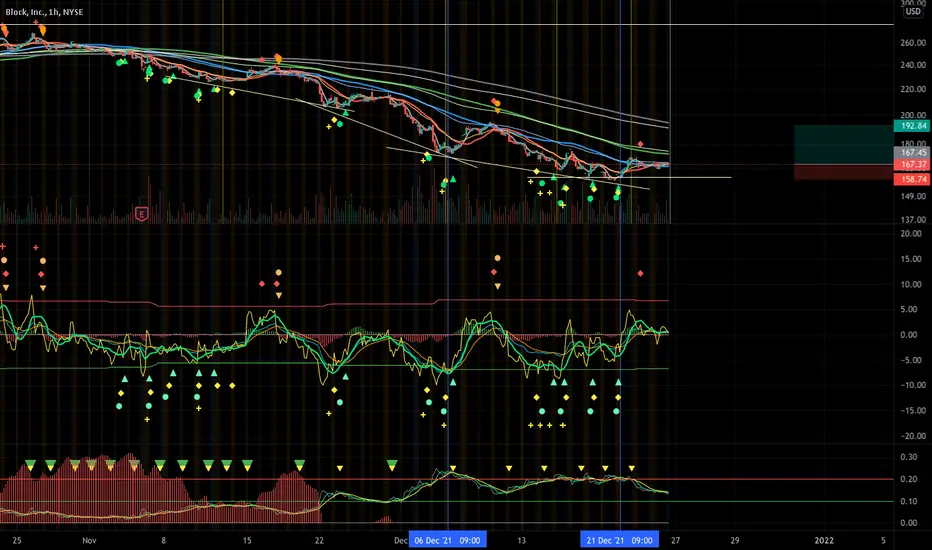
Having drop 40% from the peak, I'm seeking a sign of reversal of SQ. Checking the 1H chart, the last 3 local minimums are only 5% different. 1H chart SMA20 already crossed SMA60, and tallying with oversold RSI from 15 Dec to 20 Dec. Price trend up since then.
Buy @ 167
Stop loss @ 158
Profit @ 192
Profit to loss ratio 2.9
Buy @ 167
Stop loss @ 158
Profit @ 192
Profit to loss ratio 2.9
Disclaimer
The information and publications are not meant to be, and do not constitute, financial, investment, trading, or other types of advice or recommendations supplied or endorsed by TradingView. Read more in the Terms of Use.
Disclaimer
The information and publications are not meant to be, and do not constitute, financial, investment, trading, or other types of advice or recommendations supplied or endorsed by TradingView. Read more in the Terms of Use.