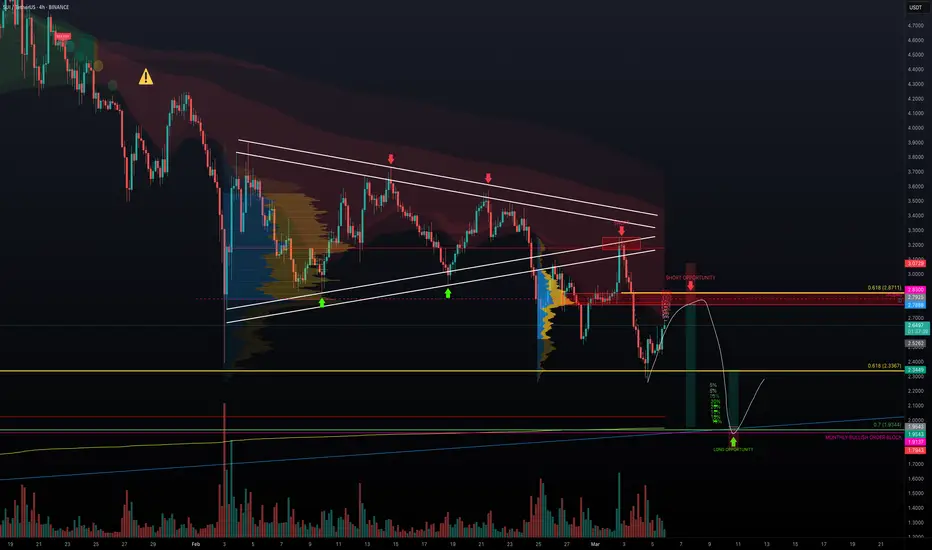
Here’s an update to the analysis I did one month ago on February 10. Since then, SUI has continued to show its bearish tendencies—making lower highs and lower lows. After that dramatic 30% drop from a golden pocket short opportunity, the price started inching up on low volume. This weak rally suggests that while buyers are testing the ceiling, the overall trend remains down. That sets the stage for two possible plays: a short trade if the price reaches the resistance zone, and a long trade if it bounces off a strong support level.
1. Identification of Support and Resistance Zones
Resistance Zone (for the Short Trade):
All these levels combine to create a robust resistance area where sellers are likely to step in.
Support Zone (for the Long Trade):
These multiple layers of confluence make the $2 area a strong support zone and an attractive entry point for a long trade.
2. Short Trade Setup
The Plan:
Building a short position gradually using a laddering strategy. With a $15,000 allocation from a $100,000 account, scale in at different levels to keep risk in check.
Scaling In (Entry Levels):
Entry # Entry Price % of Position Amount Invested ($)
1 2.6808 5% $750
2 2.7070 5% $750
3 2.7314 10% $1,500
4 2.7552 10% $1,500
5 2.7755 10% $1,500
6 2.7990 15% $2,250
7 2.8242 20% $3,000
8 2.8485 25% $3,750
Scaling Out (Exit Levels):
Exit Cover Price % of Position Amount Paid to Cover ($)
1 2.7925 5% $750.02
2 2.1715 5% $583.23
3 2.1365 10% $1,147.66
4 2.0981 20% $2,254.07
5 2.0630 20% $2,216.36
6 2.0257 10% $1,088.14
7 1.9930 15% $1,605.87
8 1.9625 15% $1,581.29
Outcome:
This laddering approach helps to secure profits at various levels while managing the risk effectively.
3. Long Trade Setup
The $2 support zone is a magnet, backed by multiple confluences. When SUI tests this area and shows signs of a rebound, it sets up a great opportunity to go long.
Key Support Details:
Trade Details:
Wrapping It Up
In this dual-setup strategy, we're well-prepared for different market outcomes:
This approach lets us capitalise on both sides of the market. Keep an eye on volume and price action. Happy trading! P.S. If you have any coin requests, feel free to share them in the comments. I will be selecting one or two for the next TA.
1. Identification of Support and Resistance Zones
Resistance Zone (for the Short Trade):
- Daily Resistance: ~2.7888
- Point of Control (POC): Around 2.8035
- Monthly Open: 2.83
- 0.618 Fibonacci Retracement: 2.8711
All these levels combine to create a robust resistance area where sellers are likely to step in.
Support Zone (for the Long Trade):
- $2 Psychological Level: A key round number that attracts attention.
- 0.7 Fibonacci Retracement: Derived from the swing low of $0.4625 to the high of $5.3687, this places an important level at 1.9344 (just below $2).
- Monthly Bullish Order Block: At 1.9137, indicating buying interest.
- Fib Speed Fan (0.786): Points to support near the $2 mark.
- POC: 2.0225
- Anchored VWAP: Calculated from the deep low at $0.362, which again aligns around $2.
These multiple layers of confluence make the $2 area a strong support zone and an attractive entry point for a long trade.
2. Short Trade Setup
The Plan:
Building a short position gradually using a laddering strategy. With a $15,000 allocation from a $100,000 account, scale in at different levels to keep risk in check.
Scaling In (Entry Levels):
Entry # Entry Price % of Position Amount Invested ($)
1 2.6808 5% $750
2 2.7070 5% $750
3 2.7314 10% $1,500
4 2.7552 10% $1,500
5 2.7755 10% $1,500
6 2.7990 15% $2,250
7 2.8242 20% $3,000
8 2.8485 25% $3,750
- Total: Avg. ~2.7924 $15,000
- Stop Loss: Set at $3.07, limiting the risk to about $1,506 (roughly 10% of the trade allocation or 1.51% of the account).
Scaling Out (Exit Levels):
Exit Cover Price % of Position Amount Paid to Cover ($)
1 2.7925 5% $750.02
2 2.1715 5% $583.23
3 2.1365 10% $1,147.66
4 2.0981 20% $2,254.07
5 2.0630 20% $2,216.36
6 2.0257 10% $1,088.14
7 1.9930 15% $1,605.87
8 1.9625 15% $1,581.29
Outcome:
- Total: Avg. ~2.09 $11,226.65
- Net Profit: $15,000 (initial proceeds) – $11,226.65 (cost to cover) = $3,773.35
- Profit % on Trade: +25.16%
- Risk-to-Reward Ratio (R:R): Approximately 2.51
This laddering approach helps to secure profits at various levels while managing the risk effectively.
3. Long Trade Setup
The $2 support zone is a magnet, backed by multiple confluences. When SUI tests this area and shows signs of a rebound, it sets up a great opportunity to go long.
Key Support Details:
- $2 Psychological Level: A well-watched price point.
- 0.7 Fibonacci Retracement: Places a key level at 1.9344 from the low ($0.4625) to the high ($5.3687).
- Monthly Bullish Order Block: At 1.9137, adding to the support.
- Fib Speed Fan (0.786): Confirms support near $2.
- POC & Anchored VWAP: Both clustering around $2 (POC at 2.0225 and VWAP from a low of $0.362).
Trade Details:
- Entry: Buy at $2.00
- Target: Sell at $2.337 for an approximate 20%+ gain
- Stop Loss: Set just below $1.80 to protect against further downside
- Risk-to-Reward Ratio: About 2.44 or better
Wrapping It Up
In this dual-setup strategy, we're well-prepared for different market outcomes:
- Short Trade: If SUI rallies into the tightly clustered resistance zone, scale into a short with defined entries, exits, and a stop loss that caps our risk at about 1.51% of the account. Exit ladder aims for an average cover price of around $2.09, netting a neat profit of approximately $3,773 (or +25.16% on the trade).
- Long Trade: Conversely, if SUI finds strong footing at the confluence-rich $2 support zone, we can flip to a long position. Entering at $2.00, with a target of $2.337 and a stop loss below $1.80, gives an attractive risk-to-reward ratio of roughly 2.44.
This approach lets us capitalise on both sides of the market. Keep an eye on volume and price action. Happy trading! P.S. If you have any coin requests, feel free to share them in the comments. I will be selecting one or two for the next TA.
Trade closed: target reached
5 days ago I outlined a dual-trade setup for SUI, targeting a short entry at around 0.618 fib resistance and a long entry at the $2 support zone. Both setups providing excellent trade opportunities with strong risk-to-reward ratios.Short Trade Execution:
SUI reached the $2.79–$2.87 resistance cluster, even touched the $3 psychological level where sellers stepped in. The planned laddered short position with entries scaling in from $2.6808 to $2.8485.
📌 Short Trade Outcome:
✅ Average Entry: ~$2.7924
✅ Exit Ladder: Covered at an average price of ~$2.09
✅ Net Profit: +$3,773.35 (+25.16% on the trade)
✅ Risk-to-Reward Ratio: ~2.5 R:R
This setup played out exactly as planned, proving the strength of the resistance zone and allowing for a highly profitable short trade.
Long Trade Execution: $2 Support Zone Holds Strong
After the short trade played out, SUI dropped into the $2 support zone, aligning with multiple confluences.
The result? A near-perfect bounce from just under $2, confirming this level as a high-probability long entry.
📌 Long Trade:
✅ Entry: ~$2.00
✅ Take Profit: $2.25, $2,5, $3
What’s Next for SUI?
With both the short trade and long trade playing out perfectly, the focus now shifts to the next key levels:
🔹 Resistance Levels to Watch: $2.50–$2.60 and $3 for possible rejections
🔹 Support Levels to Watch: $2.10–$2.00 if the market pulls back again
Mastering Fibonacci for precision trading
🔹 Sharing high-probability trade setups 🔹
⚡ Unlock the power of technical analysis! ⚡
🔹 Sharing high-probability trade setups 🔹
⚡ Unlock the power of technical analysis! ⚡
Related publications
Disclaimer
The information and publications are not meant to be, and do not constitute, financial, investment, trading, or other types of advice or recommendations supplied or endorsed by TradingView. Read more in the Terms of Use.