TEXRAIL: Elliott Wave Analysis - Weekly Chart
Source: LiveTradingBox | Chart Date: March 18, 2023
Overview
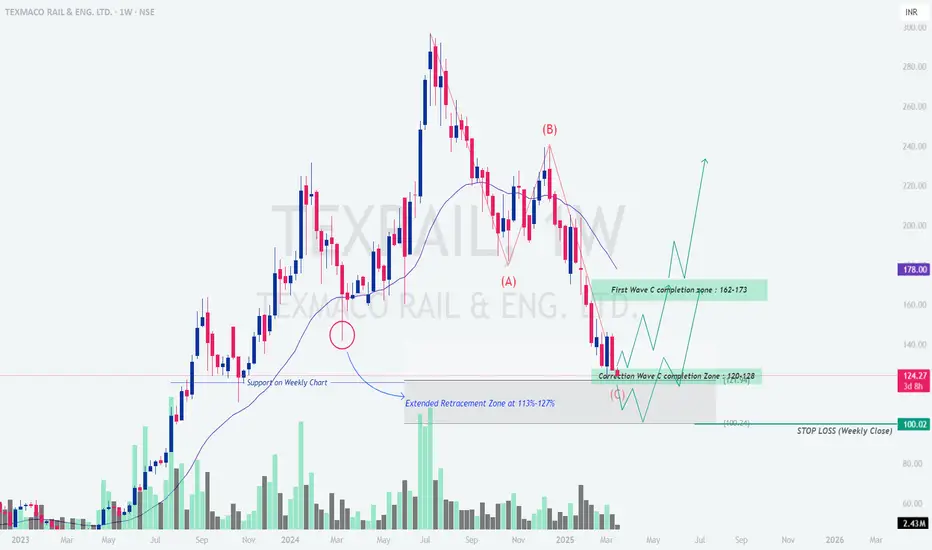
Texmaco Rail & Engineering Ltd. (TEXRAIL) rallied from 60 INR (early 2023) to 280 INR (mid-2024), a 366% gain, but has corrected to 124.27 INR. Using Elliott Wave and Fibonacci, this analysis projects the next moves.
Elliott Wave Outlook
- [] Wave (A): Decline from 280 INR to 124 INR (complete).
[] Wave (B): Counter-trend rally expected to 162–173 INR ("First Wave C completion zone"). - Wave (C): Final decline projected to 120–128 INR ("Correction Wave C completion zone").
Key Levels
- [] Resistance: 162–173 INR (Wave (B) target).
[] Support: 120–128 INR (Wave (C) target); 100.74 INR (stop loss on weekly close). - Fibonacci: 162–173 INR aligns with 23.6%–38.2% retracement of Wave (A); 120–128 INR matches 113%–127% extension.
Price Action & Volume
- [] Stock consolidating near 124 INR with smaller candlesticks, indicating indecision.
[] Volume decreasing, suggesting a potential reversal or continuation.
Trading Strategy
- [] Bullish (Wave (B)):
- [] Buy on confirmation above 128 INR.
[] Target: 162–173 INR.
[] Stop Loss: Below 100.74 INR (weekly close).
[] R:R ≈ 1.63:1.
- [] Short below 120 INR.
[] Target: 100.74 INR. - Stop: Above 128 INR.
- [] Buy on confirmation above 128 INR.
Conclusion
TEXRAIL is in a corrective ABC pattern. Expect a Wave (B) rally to 162–173 INR, followed by a Wave (C) decline to 120–128 INR. A weekly close below 100.74 INR turns the outlook bearish. Monitor price action and manage risk.
Disclaimer: For educational purposes only. Trading involves risks; do your own research.
Disclaimer
The information and publications are not meant to be, and do not constitute, financial, investment, trading, or other types of advice or recommendations supplied or endorsed by TradingView. Read more in the Terms of Use.
Disclaimer
The information and publications are not meant to be, and do not constitute, financial, investment, trading, or other types of advice or recommendations supplied or endorsed by TradingView. Read more in the Terms of Use.