📈
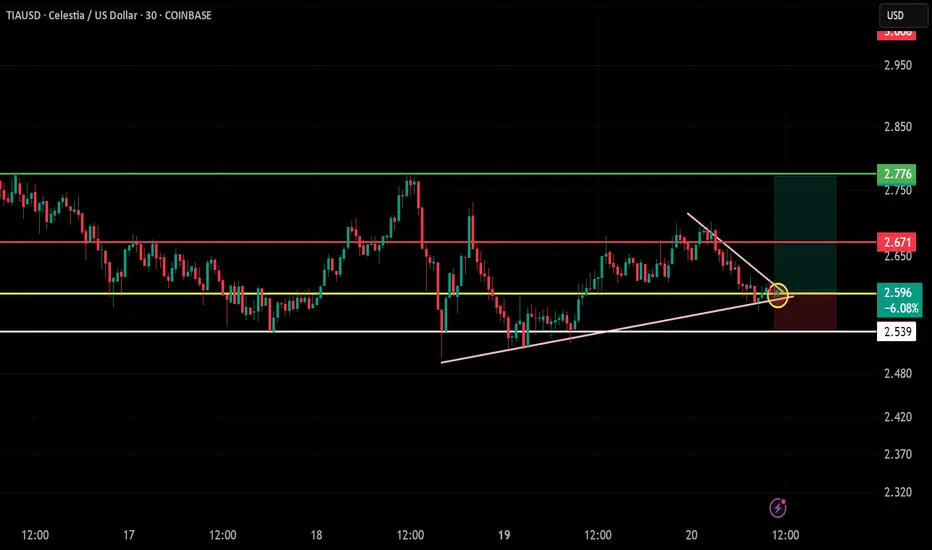
Chart: 30m timeframe
🔺 Pattern: Breakout from Downtrend Line + Ascending Triangle Support
Current price action suggests a breakout above minor descending resistance while maintaining higher lows – bullish structure.
📍 Entry Zone: Around $2.597
Breakout confirmation near triangle apex and horizontal support (yellow zone).
🛑 Stop-Loss (SL): $2.539
Below trendline support and recent swing low.
🎯 Target Levels (TP):
TP1: $2.671 (Red resistance level)
TP2: $2.776 (Green resistance zone)
TP3 (optional): $3.008–$3.10 (Major liquidity zone)
⚖️ Risk/Reward Ratio:
Excellent R:R – Close to 1:2.5+ depending on exit level.
🧠 Technical Highlights:
Volume shows a little rise post-breakout (check live for confirmation).
Downtrend line now broken.
Price respecting ascending triangle support and yellow zone (prior resistance → support flip).
✅ Bias:
Bullish above $2.59
Bearish below $2.54 (false breakout or breakdown)
Disclaimer
The information and publications are not meant to be, and do not constitute, financial, investment, trading, or other types of advice or recommendations supplied or endorsed by TradingView. Read more in the Terms of Use.
Disclaimer
The information and publications are not meant to be, and do not constitute, financial, investment, trading, or other types of advice or recommendations supplied or endorsed by TradingView. Read more in the Terms of Use.