Long
TNTBTC - potential breakout opportunity (updated chart)
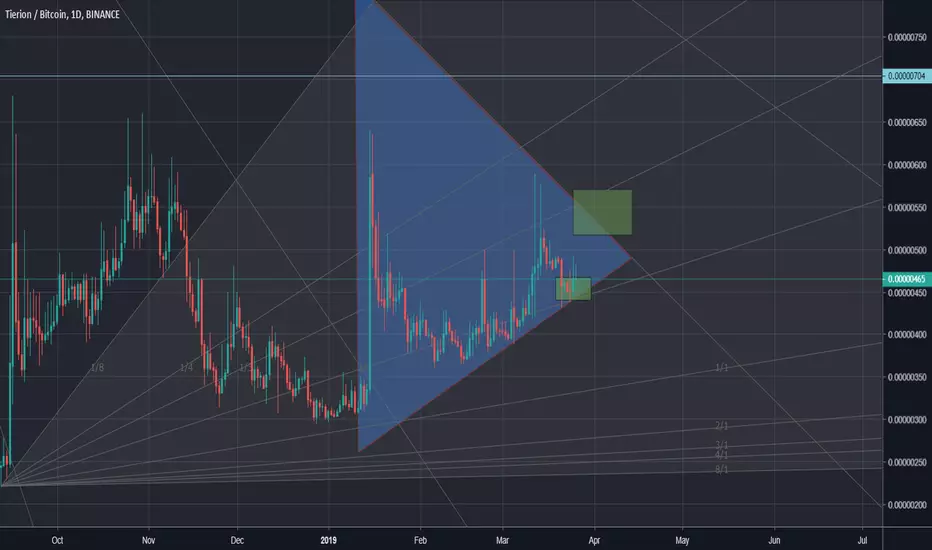
Blue triangle indicates the current range.
Green box is buy.
Red box is sell.
Blue line indicates major resistance.
TNTBTC has the potential to breakout towards the resistance line if a daily candle closes in the 550 area.
Target 1: 700
Target 2 (if the resistance line and the next fib line are broken (ie: daily close above 750)): 1050
Green box is buy.
Red box is sell.
Blue line indicates major resistance.
TNTBTC has the potential to breakout towards the resistance line if a daily candle closes in the 550 area.
Target 1: 700
Target 2 (if the resistance line and the next fib line are broken (ie: daily close above 750)): 1050
Disclaimer
The information and publications are not meant to be, and do not constitute, financial, investment, trading, or other types of advice or recommendations supplied or endorsed by TradingView. Read more in the Terms of Use.
Disclaimer
The information and publications are not meant to be, and do not constitute, financial, investment, trading, or other types of advice or recommendations supplied or endorsed by TradingView. Read more in the Terms of Use.