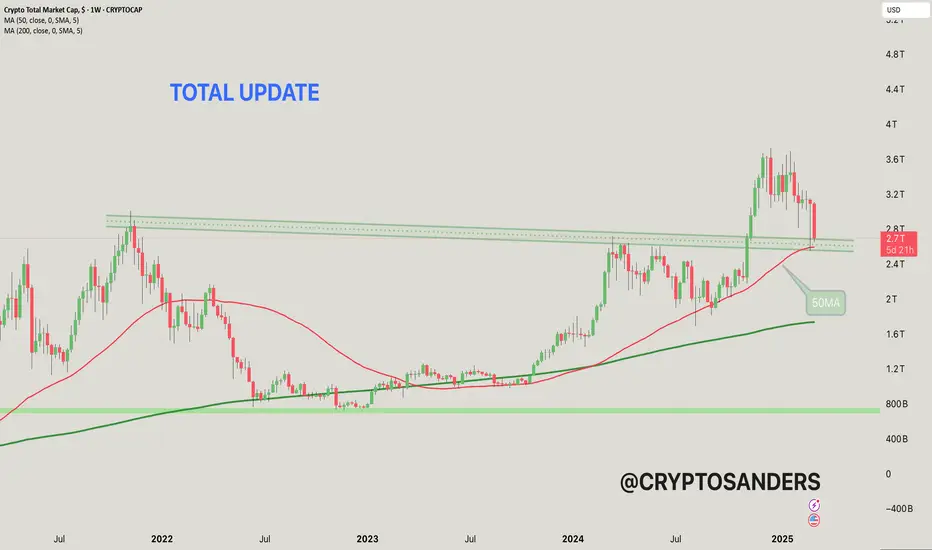
The current value is around $2.271 trillion, which represents a significant drop of 12.51% from the recent peak.
50-MA (moving average): The red line represents the 50-week moving average, which is currently around $2.59 trillion. It acts as a short-term trend indicator and potential support level.
200-MA: The green line represents the 200-week moving average, which is around $1.73 trillion, which indicates a long-term trend and strong support level.
The horizontal green lines represent support levels around $2.4 trillion and $2.6 trillion. These levels are important for a potential bullish reversal if retested.
The dotted line above the price represents resistance levels near historical highs.
The recent decline suggests the market may be in a bearish trend after failing to break the resistance levels.
If the price is above the 50-MA, it could signal a reversal towards the resistance zones and a potential recovery. However, a break below the 50-MA could signal further decline. Keep an eye on the key levels around $2.4 trillion (support) and $2.6 trillion (resistance).
If you found this analysis helpful, hit the Like button and share your thoughts or questions in the comments below. Your feedback matters!
Thanks for your support!
DYOR. NFA
Related publications
Disclaimer
The information and publications are not meant to be, and do not constitute, financial, investment, trading, or other types of advice or recommendations supplied or endorsed by TradingView. Read more in the Terms of Use.
Related publications
Disclaimer
The information and publications are not meant to be, and do not constitute, financial, investment, trading, or other types of advice or recommendations supplied or endorsed by TradingView. Read more in the Terms of Use.