Price has successfully broken above key resistance levels on both the 6-Day and 6-Week timeframes, signaling continued bullish momentum.
Here’s the detailed observation:
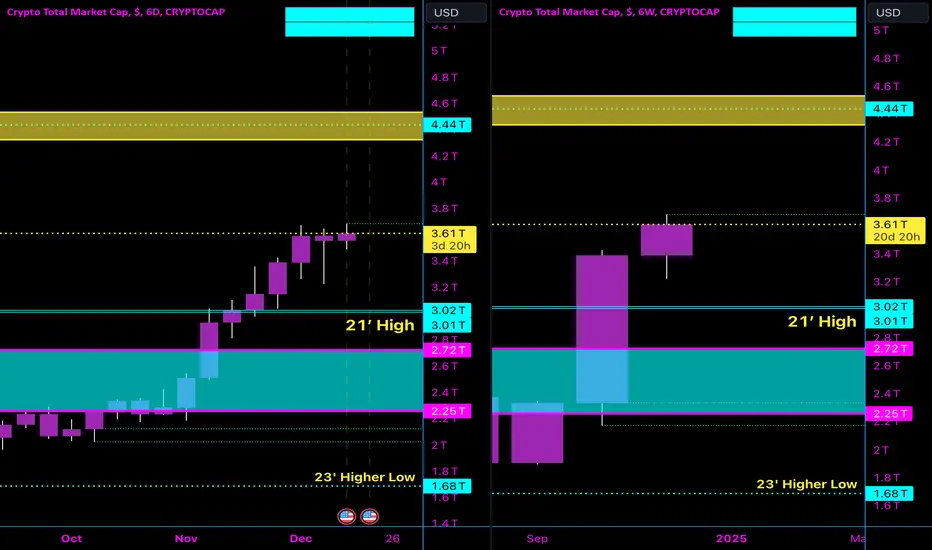
1. 6-Day Chart:
• Price has cleared previous resistance and is holding above key levels.
• A clear cup formation (highlighted) is visible, typically indicating a bullish continuation pattern.
• Consolidation at this point shows strength, as it allows price to build momentum for the next push upwards.
2. 6-Week Chart:
• The bullish candle structure looks strong and clean.
• Price remains above the 21’ High, which acts as a significant support level.
• Volume and structure indicate a healthy trend, with no signs of reversal at this point.
• This timeframe aligns with the bullish sentiment, further confirming the upward trajectory.
Summary:
The bullish momentum remains intact across multiple timeframes. The break above resistance combined with consolidation is a strong indicator that price is preparing for the next leg up. Monitoring the 6-Day and 6-Week charts closely will help confirm continued strength as the market progresses.
Here’s the detailed observation:
1. 6-Day Chart:
• Price has cleared previous resistance and is holding above key levels.
• A clear cup formation (highlighted) is visible, typically indicating a bullish continuation pattern.
• Consolidation at this point shows strength, as it allows price to build momentum for the next push upwards.
2. 6-Week Chart:
• The bullish candle structure looks strong and clean.
• Price remains above the 21’ High, which acts as a significant support level.
• Volume and structure indicate a healthy trend, with no signs of reversal at this point.
• This timeframe aligns with the bullish sentiment, further confirming the upward trajectory.
Summary:
The bullish momentum remains intact across multiple timeframes. The break above resistance combined with consolidation is a strong indicator that price is preparing for the next leg up. Monitoring the 6-Day and 6-Week charts closely will help confirm continued strength as the market progresses.
Related publications
Disclaimer
The information and publications are not meant to be, and do not constitute, financial, investment, trading, or other types of advice or recommendations supplied or endorsed by TradingView. Read more in the Terms of Use.
Related publications
Disclaimer
The information and publications are not meant to be, and do not constitute, financial, investment, trading, or other types of advice or recommendations supplied or endorsed by TradingView. Read more in the Terms of Use.