Based on the provided 4-hour chart of TSLA, here is a brief summary and outlook.
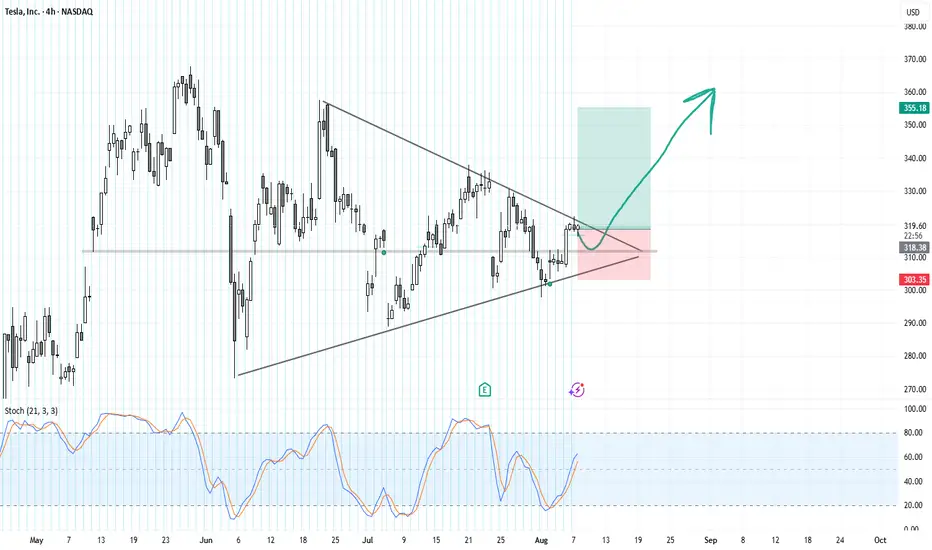
Tesla's stock price has been consolidating within a symmetrical triangle pattern since late May. The price is currently trading near the upper boundary of this triangle, which is a critical resistance level. The stochastic indicator is showing a bullish crossover and is trending upwards, but it is not yet in the overbought territory.
The chart presents two potential scenarios for the immediate future. A bullish breakout (green arrow) would occur if the price successfully breaks above the upper trendline and the resistance around $320. This could lead to a significant move towards the next target, potentially around $355, as indicated by the length of the triangle's base. Conversely, a bearish scenario (red shaded area) would see the price fail to break out and instead fall back towards the lower support trendline, possibly testing the support level around $303.
The key to the next move is a decisive breakout from the current pattern. Traders should monitor for a clear break above or below the trendlines with increased volume to confirm the direction. A successful breakout to the upside would signal a continuation of the previous uptrend, while a breakdown to the downside would suggest a potential bearish reversal. The support and resistance levels marked on the chart are key reference points for managing risk and setting targets.
Disclaimer
The information and publications are not meant to be, and do not constitute, financial, investment, trading, or other types of advice or recommendations supplied or endorsed by TradingView. Read more in the Terms of Use.
Disclaimer
The information and publications are not meant to be, and do not constitute, financial, investment, trading, or other types of advice or recommendations supplied or endorsed by TradingView. Read more in the Terms of Use.