Idea Text:
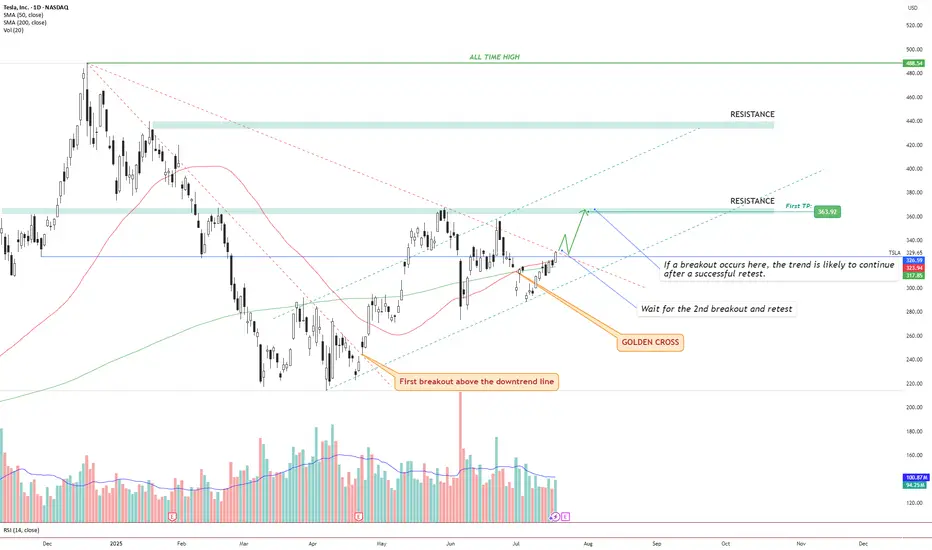
Tesla TSLA has recently printed a powerful Golden Cross, where the 50 SMA has crossed above the 200 SMA — signaling a potential long-term bullish shift in trend.
But price action shows more:
We’re observing a dual-breakout structure, where the first breakout above the long-term downtrend line has already occurred (see orange label), and the price is now approaching a critical horizontal resistance zone.
Let’s break it down step-by-step:
🔸 Step 1: Golden Cross
The 50 SMA crossed above 200 SMA — a classic signal for trend reversal. This often attracts institutional interest, especially if followed by breakout confirmation.
🔸 Step 2: First Breakout (Already Confirmed)
Price broke above the descending trendline, retested it, and maintained higher structure. This breakout initiated a shift in market sentiment from bearish to neutral-bullish.
🔸Step 3: Second Breakout (Setup Forming)
Price is now testing horizontal resistance around $330–$335 zone. This zone also coincides with dynamic resistance from prior failed swing attempts. A successful breakout above this level, followed by a clean retest, can serve as confirmation for a bullish continuation.
🔸 Step 4: Target Setting
🎯 First TP is set at $363.92, a well-defined resistance level. If the breakout holds, next potential targets may develop around key zones such as $395 and $440, depending on price strength and continuation.
🔸 Risk Management
✅ Ideal entry after retest of breakout above ~$335.
❌ Stop-loss below the breakout level or below 50 SMA (~$315 area), depending on entry style.
🔄 Monitor volume: breakout without volume = weak move.
Conclusion:
We are watching a classic price action + moving average confluence setup. Golden Cross, breakout + retest structure, clean resistance level, and defined targets all align.
⚠️ Not financial advice. DYOR.
Tesla
But price action shows more:
We’re observing a dual-breakout structure, where the first breakout above the long-term downtrend line has already occurred (see orange label), and the price is now approaching a critical horizontal resistance zone.
Let’s break it down step-by-step:
🔸 Step 1: Golden Cross
The 50 SMA crossed above 200 SMA — a classic signal for trend reversal. This often attracts institutional interest, especially if followed by breakout confirmation.
🔸 Step 2: First Breakout (Already Confirmed)
Price broke above the descending trendline, retested it, and maintained higher structure. This breakout initiated a shift in market sentiment from bearish to neutral-bullish.
🔸Step 3: Second Breakout (Setup Forming)
Price is now testing horizontal resistance around $330–$335 zone. This zone also coincides with dynamic resistance from prior failed swing attempts. A successful breakout above this level, followed by a clean retest, can serve as confirmation for a bullish continuation.
🔸 Step 4: Target Setting
🎯 First TP is set at $363.92, a well-defined resistance level. If the breakout holds, next potential targets may develop around key zones such as $395 and $440, depending on price strength and continuation.
🔸 Risk Management
✅ Ideal entry after retest of breakout above ~$335.
❌ Stop-loss below the breakout level or below 50 SMA (~$315 area), depending on entry style.
🔄 Monitor volume: breakout without volume = weak move.
Conclusion:
We are watching a classic price action + moving average confluence setup. Golden Cross, breakout + retest structure, clean resistance level, and defined targets all align.
This setup is valid only with confirmation. No breakout = no trade.
⚠️ Not financial advice. DYOR.
Disclaimer
The information and publications are not meant to be, and do not constitute, financial, investment, trading, or other types of advice or recommendations supplied or endorsed by TradingView. Read more in the Terms of Use.
Disclaimer
The information and publications are not meant to be, and do not constitute, financial, investment, trading, or other types of advice or recommendations supplied or endorsed by TradingView. Read more in the Terms of Use.