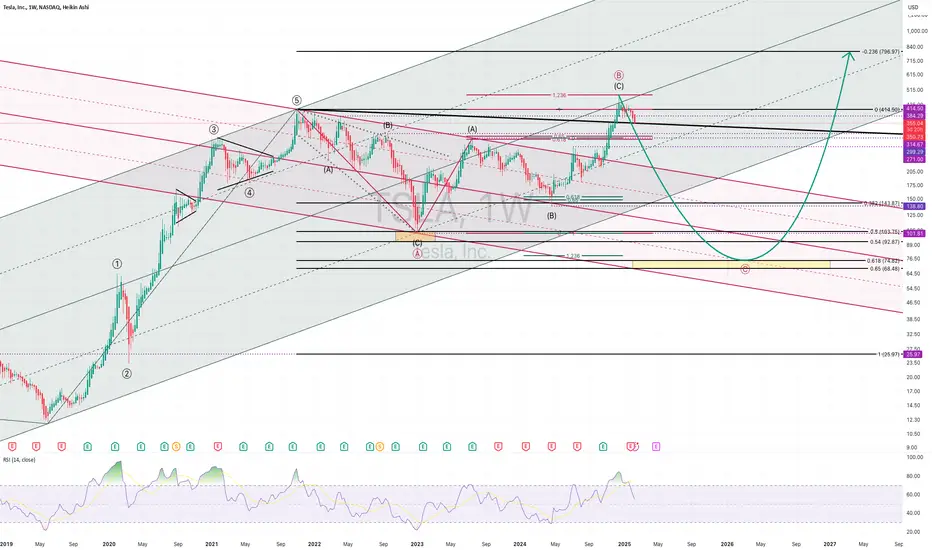
Expanded Flat Pattern
Wave A (2022 Crash)
• Tesla dropped from ~$415 to ~$100, forming a three-wave (ABC) decline.
• This marked the first phase of the Expanded Flat.
Wave B (2023-2024 Rally)
• Tesla rebounded strongly to ~$360-$400, retracing about 61.8% of Wave A.
• Then overshoot beyond Wave A’s starting level confirms an Expanded Flat structure.
Wave C (2024-2026 Expected) – $70 Target
• Now unfolding as a five-wave impulse down.
• Target zone: Primary $70 (0.618 Fib retracement)
Short-Term Bearish Outlook – Wave C Down to $70
• Tesla is in Wave C, meaning more downside is ahead.
• Breaking below $150 will confirm a deep drop to $70
• The final phase of selling will likely coincide with macro weakness (recession etc.).
Long-Term Bullish Setup
• Once Wave C completes at $70, Tesla should start a new impulse wave.
• Target for next bull run: $800+.
• Best strategy: Accumulate Tesla below $100 for long-term gains.
Note
Intermediate HWB (Half-Way-Back) hitNote
Intermediate GZ (Golden Zone) hitIn technical analysis, several methods focus on higher timeframes to provide a broader, more reliable context for trading or investment decisions. Elliott Wave Principle generally considers historical higher timeframes as mandatory.
Disclaimer
The information and publications are not meant to be, and do not constitute, financial, investment, trading, or other types of advice or recommendations supplied or endorsed by TradingView. Read more in the Terms of Use.
In technical analysis, several methods focus on higher timeframes to provide a broader, more reliable context for trading or investment decisions. Elliott Wave Principle generally considers historical higher timeframes as mandatory.
Disclaimer
The information and publications are not meant to be, and do not constitute, financial, investment, trading, or other types of advice or recommendations supplied or endorsed by TradingView. Read more in the Terms of Use.