Click Here🖱️ and scroll down👇 for the technicals, and more behind this analysis!!!
________________________________________________________
________________________________________________________
..........✋NFA👍..........
📈Technical/Fundamental/Target Standpoint⬅️
1.) Revenue and Profitability: While 2024 revenue was relatively stable compared to 2023, a concerning trend is the decline in net income back to 2021 levels.
2.) Cash Flow and Liquidity: Free cash flow and cash equivalents saw a slight decrease in 2024 compared to 2023. While not dramatic, this bears monitoring as it could indicate challenges in generating cash.
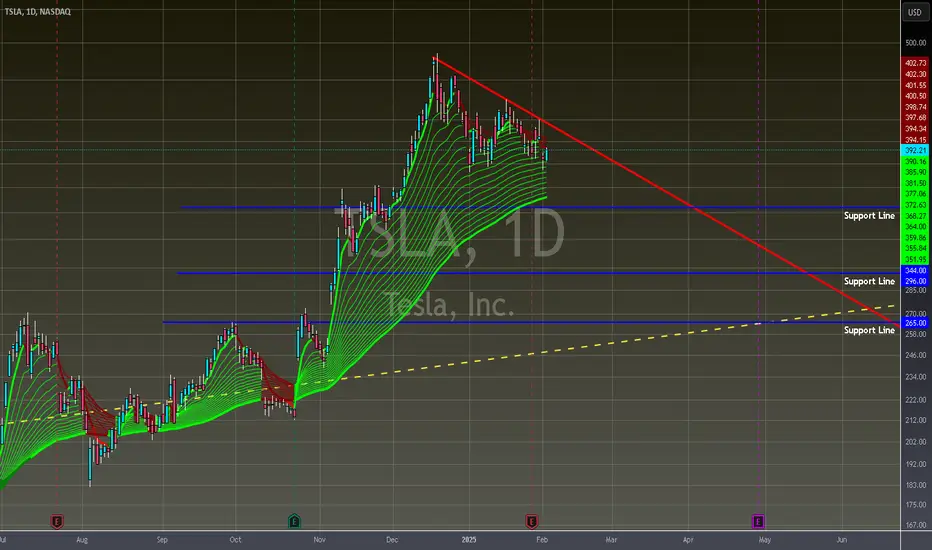
3.) Price Trend Analysis:
- Short-Term: Currently in a local downtrend, but indicators suggest a potential shift to sideways trading in the near future. This implies a period of consolidation may be on the horizon.
- Support Levels: Key support levels identified at $344, $296, and $265. These are price points where buyers might be expected to enter the market, potentially halting further declines. Breaking below these levels could signal further downside.
- Medium to Long-Term: Despite the short-term bearish sentiment, the medium to long-term outlook remains bullish.
🌎Global Market Sentiment⬅️
1.) Historically, February has shown a mixed performance pattern. While it has been positive more often than not in recent decades, it's not always a consistently strong month.
==============================
...🎉🎉🎉Before You Go🎉🎉🎉…
==============================
Leave a like👍 and/or comment💬.
We appreciate and value everyone's feedback!
- RoninAITrader
________________________________________________________
________________________________________________________
..........✋NFA👍..........
📈Technical/Fundamental/Target Standpoint⬅️
1.) Revenue and Profitability: While 2024 revenue was relatively stable compared to 2023, a concerning trend is the decline in net income back to 2021 levels.
2.) Cash Flow and Liquidity: Free cash flow and cash equivalents saw a slight decrease in 2024 compared to 2023. While not dramatic, this bears monitoring as it could indicate challenges in generating cash.
3.) Price Trend Analysis:
- Short-Term: Currently in a local downtrend, but indicators suggest a potential shift to sideways trading in the near future. This implies a period of consolidation may be on the horizon.
- Support Levels: Key support levels identified at $344, $296, and $265. These are price points where buyers might be expected to enter the market, potentially halting further declines. Breaking below these levels could signal further downside.
- Medium to Long-Term: Despite the short-term bearish sentiment, the medium to long-term outlook remains bullish.
🌎Global Market Sentiment⬅️
1.) Historically, February has shown a mixed performance pattern. While it has been positive more often than not in recent decades, it's not always a consistently strong month.
==============================
...🎉🎉🎉Before You Go🎉🎉🎉…
==============================
Leave a like👍 and/or comment💬.
We appreciate and value everyone's feedback!
- RoninAITrader
Disclaimer
The information and publications are not meant to be, and do not constitute, financial, investment, trading, or other types of advice or recommendations supplied or endorsed by TradingView. Read more in the Terms of Use.
Disclaimer
The information and publications are not meant to be, and do not constitute, financial, investment, trading, or other types of advice or recommendations supplied or endorsed by TradingView. Read more in the Terms of Use.