Long
TSNPD Possible Support Level
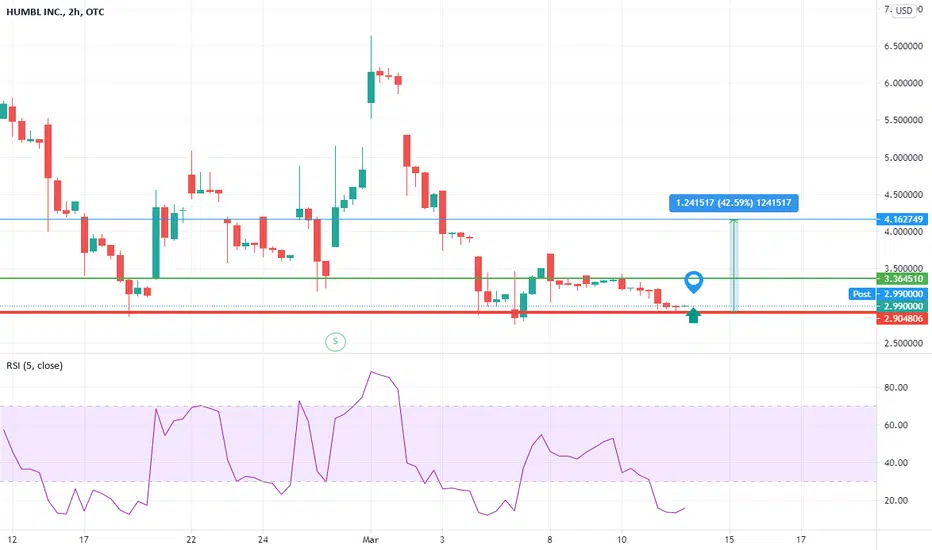
Using support and resistance, candlestick wicks, and Thursday's (March 11) close of a doji it is possible we have found a key weekly support level at just below the $3.00 range. Could possibly fall a bit further to $2.75-$2.85 range. RSI signals that this stock is oversold. Stock could find it's next resistance at just below $3.50 level and if it clears this, $4.20 is a realistic price target. This analysis was completed using multiple time frames (from 1 week all the way down to 30 minutes) to give me further conviction of what I am saying. I posted the chart with a 4 hour time frame because this one allows you to see other key levels of support and resistance. Of course no one can predict what will occur so don't just take my word for it, do your own due dilligence.
Additionally, this is my first posted chart so take that into account. If there are any experts out there please let me know what you think about my analysis. I am trying to get better and want constructive criticism. For those who look at the chart, please let me know if you can understand what the chart says. I tried to color code it a bit. The support line is in red and the next possible resistance level is green. The upward arrow is where I think price will go.
Additionally, this is my first posted chart so take that into account. If there are any experts out there please let me know what you think about my analysis. I am trying to get better and want constructive criticism. For those who look at the chart, please let me know if you can understand what the chart says. I tried to color code it a bit. The support line is in red and the next possible resistance level is green. The upward arrow is where I think price will go.
Disclaimer
The information and publications are not meant to be, and do not constitute, financial, investment, trading, or other types of advice or recommendations supplied or endorsed by TradingView. Read more in the Terms of Use.
Disclaimer
The information and publications are not meant to be, and do not constitute, financial, investment, trading, or other types of advice or recommendations supplied or endorsed by TradingView. Read more in the Terms of Use.