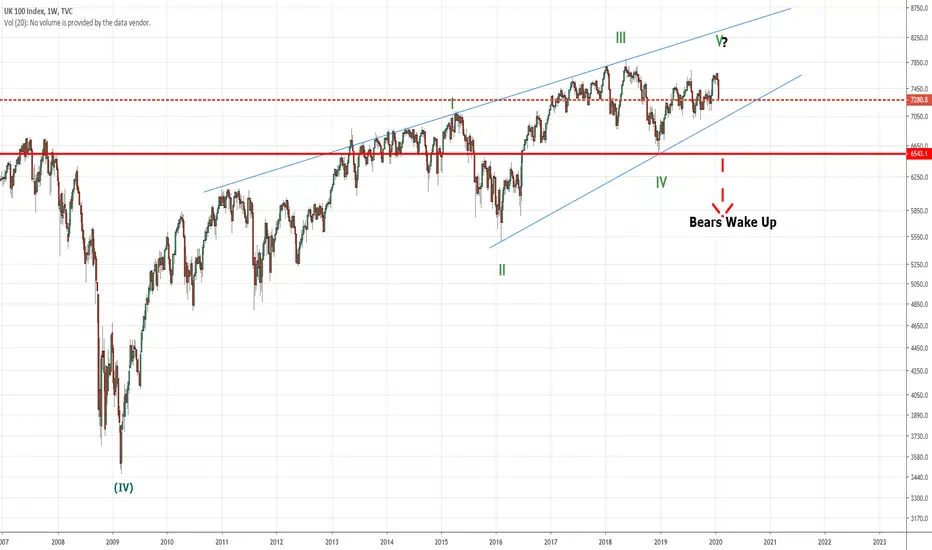
I have looked back over my previous longer term FTSE posts since 2009 and I still believe an ending diagonal
is in play albeit with a different wave count location.
This chart suggests that cycle wave V is well advanced and of course there are numerous options which will
dictate when it is complete.
Given the choppiness of FTSE over the last year I hesitate to suggest the end for wave V. However I will
predict that if and when the bold red line is broken at around 6543 the Bears Will be well awake and hungry.
Good Luck
Disclaimer
The information and publications are not meant to be, and do not constitute, financial, investment, trading, or other types of advice or recommendations supplied or endorsed by TradingView. Read more in the Terms of Use.
Disclaimer
The information and publications are not meant to be, and do not constitute, financial, investment, trading, or other types of advice or recommendations supplied or endorsed by TradingView. Read more in the Terms of Use.