UNO MINDA is showing strong bullish momentum after forming a base and reclaiming the 200 EMA. The breakout from the falling channel and consolidation near resistance suggest strength. As long as it sustains above ₹1020, accumulation in the 1100–1110 range is favorable for a move toward ₹1300+
Weekly Chart:-

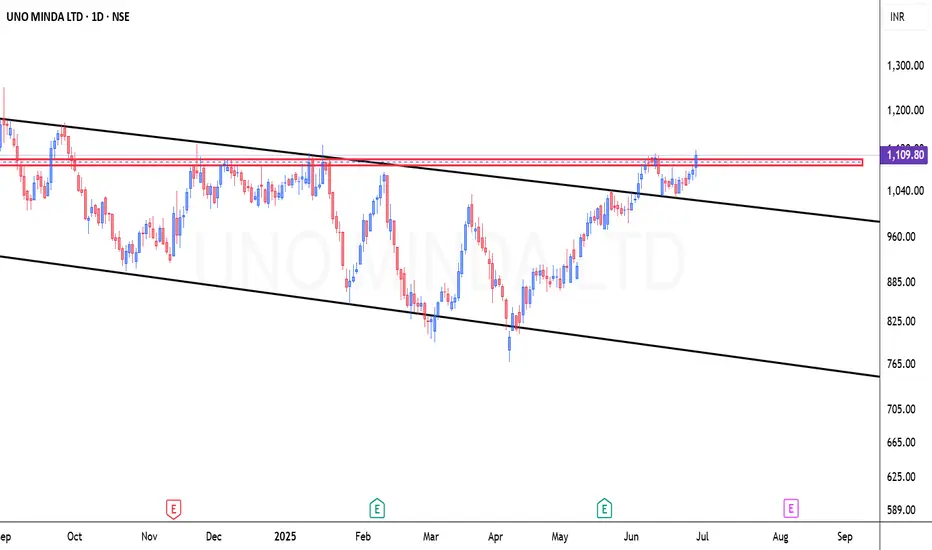
Daily Chart:-

The stock has:
Formed a strong base around ₹850–₹900.
Broken above the 200-day EMA with strength.
Recently made higher highs and higher lows, which is a bullish price structure.
Consolidated near a resistance zone (around ₹1100–₹1120) and is now trying to break above it.
Chart Pattern Insight:
The stock was earlier trading within a downward-sloping channel (black trendlines).
It has recently broken out of the upper boundary of this channel.
A horizontal resistance zone (highlighted in red) around ₹1110 is currently being tested.
If the price closes convincingly above ₹1120, it would confirm a bullish breakout.
Weekly Chart:-
Daily Chart:-
The stock has:
Formed a strong base around ₹850–₹900.
Broken above the 200-day EMA with strength.
Recently made higher highs and higher lows, which is a bullish price structure.
Consolidated near a resistance zone (around ₹1100–₹1120) and is now trying to break above it.
Chart Pattern Insight:
The stock was earlier trading within a downward-sloping channel (black trendlines).
It has recently broken out of the upper boundary of this channel.
A horizontal resistance zone (highlighted in red) around ₹1110 is currently being tested.
If the price closes convincingly above ₹1120, it would confirm a bullish breakout.
Disclaimer
The information and publications are not meant to be, and do not constitute, financial, investment, trading, or other types of advice or recommendations supplied or endorsed by TradingView. Read more in the Terms of Use.
Disclaimer
The information and publications are not meant to be, and do not constitute, financial, investment, trading, or other types of advice or recommendations supplied or endorsed by TradingView. Read more in the Terms of Use.