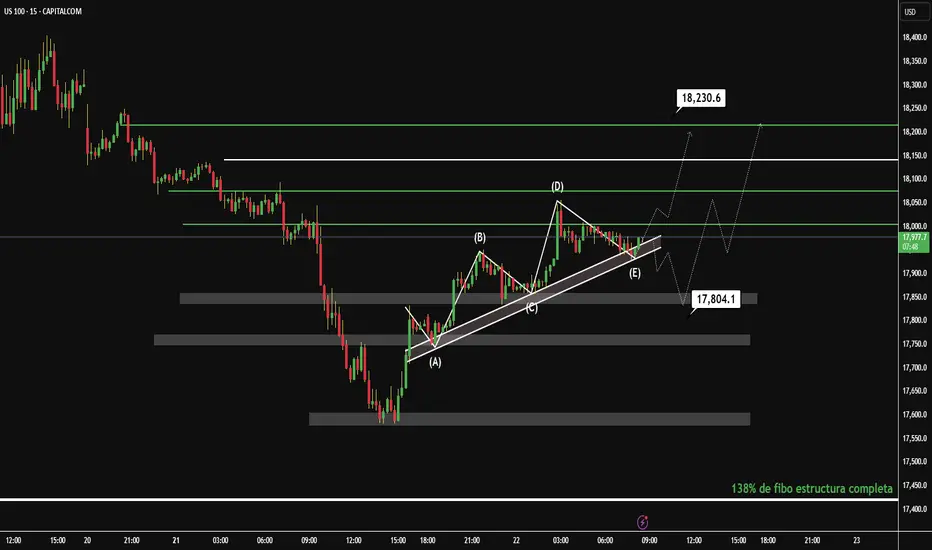
The 15-minute chart of the NASDAQ shows a recent bullish move following a correction. I identify an interesting technical structure that could indicate an upcoming directional move.
Technical Analysis:
Patterns and Structure:
Symmetrical Triangle (A): The price has formed a symmetrical triangle between points (B) and (D), suggesting consolidation before a breakout. This pattern is neutral, but the recent upside breakout indicates a possible bullish continuation.
Fibonacci: The retracement from the high at (D) to the low at (E) reached the 38.2% Fibonacci level, which acted as dynamic support (17,804.1). This level is key and reinforces the validity of the current rebound.
Support and Resistance:
Support: The 17,804.1 level (38.2% Fibonacci) and the triangle base at 17,797.2 are key supports.
Resistance: The next upside target is at 18,230.6, a previous resistance level. If the price breaks above it, it could target 18,400.
Trend:
The breakout of the symmetrical triangle and the rebound from the 38.2% Fib confirm a short-term uptrend. The price is breaking the triangle's downtrend line (E), reinforcing the bullish momentum.
Trading Idea:
Entry: Consider a long entry (buy) at the current level (~18,000) or wait for a pullback to the support at 17,804.1 for a better risk-reward ratio.
Target: First target at 18,230.6 (resistance). If the momentum continues, the next level to watch is 18,400.
Stop Loss: Below the support at 17,797.2, to protect against a false breakout.
Risk/Reward: An entry at 18,000 with a stop at 17,797 and a target at 18,230 offers an R/B ratio of approximately 1:1.2.
Conclusion:
The NASDAQ at 15M shows a bullish breakout following a symmetrical triangle, with support at the 38.2% Fibonacci level. The short-term trend is bullish, with an initial target at 18,230.6. Monitor support at 17,804.1 to confirm the continuation of the move.
This analysis is concise and structured for a TradingView post. If you need adjustments or more details, please let me know.
Disclaimer: Grok is not a financial advisor; please consult one. Do not share information that could identify you.
Trade closed: target reached
Disclaimer
The information and publications are not meant to be, and do not constitute, financial, investment, trading, or other types of advice or recommendations supplied or endorsed by TradingView. Read more in the Terms of Use.
Disclaimer
The information and publications are not meant to be, and do not constitute, financial, investment, trading, or other types of advice or recommendations supplied or endorsed by TradingView. Read more in the Terms of Use.