Overall Trend:
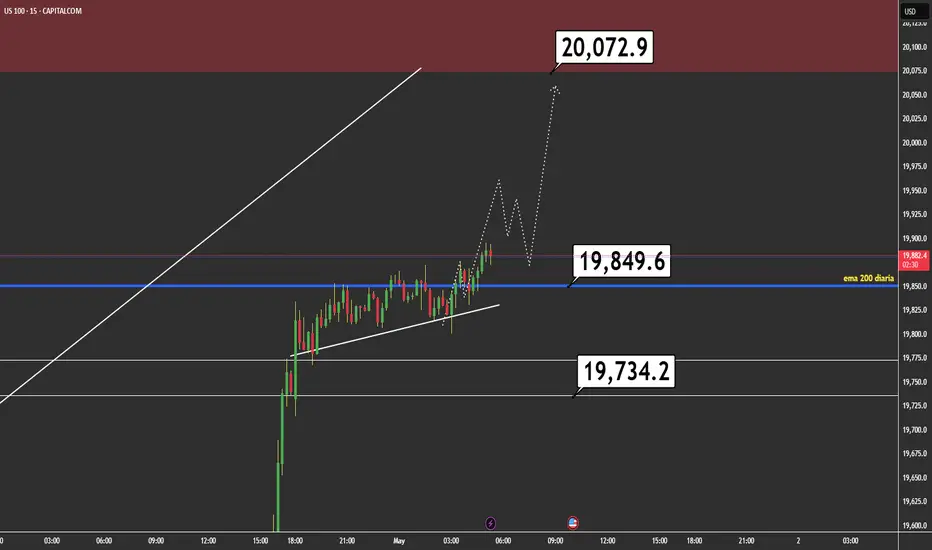
The price shows a clear uptrend, as indicated by the ascending channel (sloping yellow lines). The price has been respecting this channel, with higher lows and higher highs.
Support and Resistance:
Support: The 19,734.2 level (marked on the chart) has acted as a key support. The price bounced from this level after a correction.
Resistance: The 19,849.6 level (also marked) appears to be a resistance zone, as the price has shown difficulty breaking above it on a sustained basis.
Projection: The price is approaching potential resistance at 20,072.9, which could be a target if the uptrend continues.
Indicators:
200-period EMA (blue line): The price is above the 200-period EMA, confirming the uptrend on this timeframe. The EMA is around 19,889.4, acting as dynamic support.
Patterns and Structure:
The price has broken out after consolidating near the 200 EMA and the support at 19,734.2, suggesting that buyers are in control.
Possible Scenarios:
Bullish Scenario: If the price breaks the resistance at 19,849.6 with increasing volume, it could head toward the target at 20,072.9. This would confirm the continuation of the uptrend within the channel.
Bearish Scenario: If the price fails to break above the resistance at 19,849.6 and confirms the pin bar with a downward movement, it could correct toward the support at 19,734.2 or even the 200 EMA at 19,889.4.
Trader Recommendation:
Long Entry (Buy): Wait for a breakout and close above 19,849.6 with confirmation (e.g., a strong bullish candle or increased volume). The target would be 20,072.9, with a stop loss below 19,734.2.
Short Entry (Sell): If a rejection at 19,849.6 is confirmed (e.g., with a bearish candle following the Pin Bar), consider a sell entry with a target at 19,734.2 or the 200 EMA, placing a stop loss above 19,849.6.
Conclusion:
The US 100 is in an uptrend, but the resistance at 19,849.6 and the Pin Bar suggest caution. Traders should wait for confirmation before entering positions, either to take advantage of the bullish continuation or a possible correction. Managing risk is key, especially on a 15-minute time frame, where volatility can be high.
Disclaimer
The information and publications are not meant to be, and do not constitute, financial, investment, trading, or other types of advice or recommendations supplied or endorsed by TradingView. Read more in the Terms of Use.
Disclaimer
The information and publications are not meant to be, and do not constitute, financial, investment, trading, or other types of advice or recommendations supplied or endorsed by TradingView. Read more in the Terms of Use.