Long
US30 BUY SIGNAL
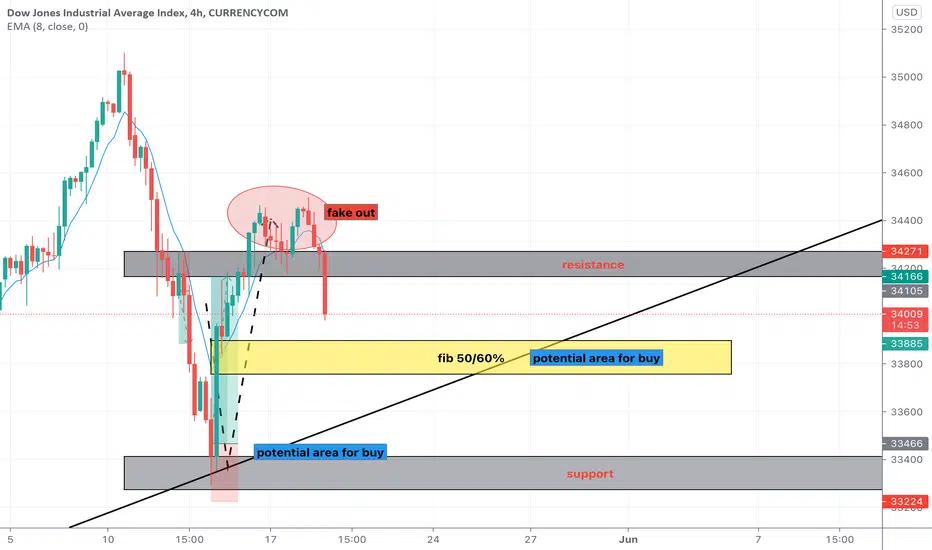
May 13 => price bounced off the support and daily trendline
May 14-18 => price broke through resistance but it was a fake breakout and price is now falling back down
Prediction: Im expecting price to EITHER:
1. pull back to the 50%-60% fibonacci retracement area then continue up
OR
2. retest again the daily trendline and support before continuing up
READ HOW THE CANDLES ARE FORMING AT THE POTENTIAL BUY AREAS AND ONLY ENTER A BUY POSITION IF BULLISH CANDLESTICK PATTERNS APPEAR AT THE AREAS OR THERE ARE SIGNS OF REVERSAL
~trade responsibly
~patience is key
GODBLESS Y'ALL MAY WE ALL BE RICH
Note
in the 1hr timeframe price was rejected by the trendline then a bullish engulfing candle formed. i entered a buy at the closing of the engulfing candle
entry: 33728
sl: 33459
Disclaimer
The information and publications are not meant to be, and do not constitute, financial, investment, trading, or other types of advice or recommendations supplied or endorsed by TradingView. Read more in the Terms of Use.
Disclaimer
The information and publications are not meant to be, and do not constitute, financial, investment, trading, or other types of advice or recommendations supplied or endorsed by TradingView. Read more in the Terms of Use.