Title:
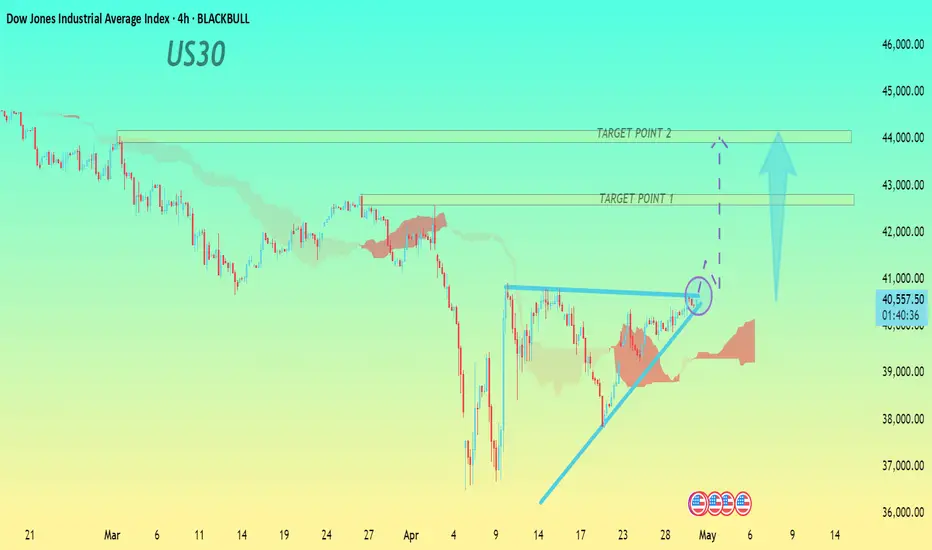
"US30 Bullish Breakout Setup – 4H Timeframe (Chart Pattern Analysis)"
Entry Point:
Consider entering a buy trade upon a confirmed breakout above the resistance trendline (around 40,800 – 41,000 zone), marked by the blue circle.
Target Point 1:
First target is around 42,500, which aligns with the first resistance zone and previous price structure.
Target Point 2:
Second (extended) target is near 44,000, where the next major resistance zone is marked.
Stop-Loss (SL):
Set SL below the breakout structure and ascending trendline, around 39,500 – 39,700, to manage risk if the breakout fails.
The chart illustrates a bullish ascending triangle pattern, suggesting accumulation before a breakout. The price is also supported by Ichimoku cloud structure showing a possible bullish shift. A breakout above resistance could trigger a strong move toward the outlined targets, offering a solid risk-reward opportunity.
FREE Trading Signals ..
t.me/Smart_Money_Trader_SMC
Forex, Gold & Crypto Signals with detailed analysis & get consistent results..
t.me/TradingViewAccurate786
t.me/Smart_Money_Trader_SMC
Forex, Gold & Crypto Signals with detailed analysis & get consistent results..
t.me/TradingViewAccurate786
Disclaimer
The information and publications are not meant to be, and do not constitute, financial, investment, trading, or other types of advice or recommendations supplied or endorsed by TradingView. Read more in the Terms of Use.