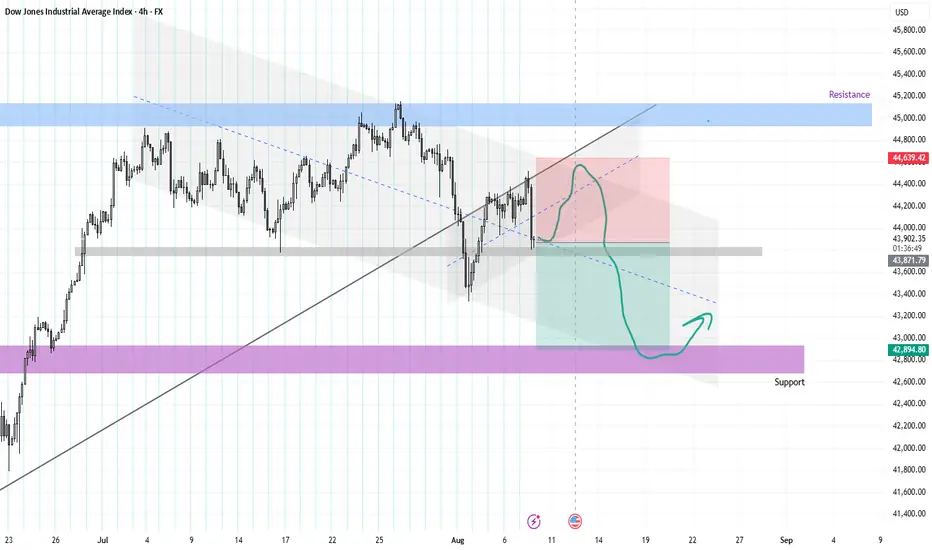
This chart displays the Dow Jones Industrial Average Index (4H timeframe), with key technical zones and trendlines marked to illustrate potential price movements. The price is currently at 43,894, just below a key ascending trendline (black) that has been recently broken. The chart also highlights resistance around 45,000 (blue zone) and support near 42,800 (purple zone).
The green curved path drawn on the chart indicates a potential bearish scenario. After a brief consolidation around the current price and broken trendline, the price is expected to fail to reclaim the previous structure, leading to a drop. The projected move suggests a sharp decline toward the support zone around 42,800, where demand might return and trigger a bounce.
This scenario implies bearish pressure in the short term, possibly due to rejection from the resistance zone and loss of trendline support. The suggested bounce near 42,800 implies that this level could serve as a buying opportunity or a reversal point, making it a key area to watch for potential long setups or confirmation of continued weakness.
Disclaimer
The information and publications are not meant to be, and do not constitute, financial, investment, trading, or other types of advice or recommendations supplied or endorsed by TradingView. Read more in the Terms of Use.
Disclaimer
The information and publications are not meant to be, and do not constitute, financial, investment, trading, or other types of advice or recommendations supplied or endorsed by TradingView. Read more in the Terms of Use.