US30, 1 Hour
Analysis:
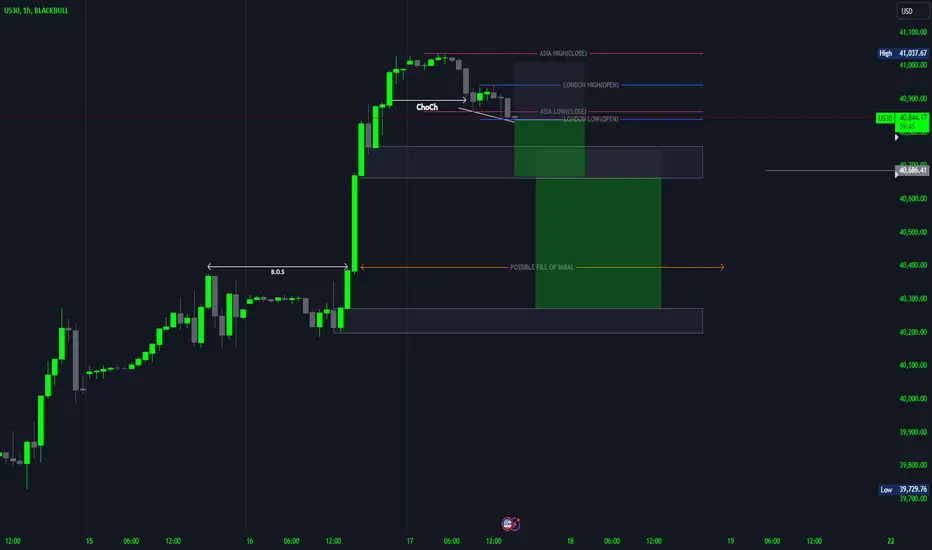
Market Structure:
The chart shows a clear bullish trend leading up to the current trading range.
A Break of Structure (B.O.S) is identified, indicating a significant move upward.
Key Levels:
Asia High (Close): This level marks the highest point reached during the Asian trading
session.
Asia Low (Close): The lowest point during the Asian session.
London High (Open): The high point at the opening of the London session.
London Low (Open): The low point at the opening of the London session.
Change of Character (ChoCh):
The ChoCh indicates a potential shift in market sentiment or a possible reversal point.
Trade Setup:
The chart suggests a potential short position based on the current price action.
Entry is marked just below the London High (Open) level.
Stop Loss is placed above the recent high, near the Asia High (Close).
Take Profit is projected at the possible fill of imbalance around the 40,400.00 level, which is aligned with previous support/resistance levels.
Risk Management:
The red box represents the risk area for the trade, indicating the stop-loss range.
The green box shows the potential reward area, indicating the take-profit target.
Additional Observations:
The trade aims to capitalize on a potential retracement or correction after the recent bullish run.
Monitoring the price action around the marked levels is crucial to validate the trade setup.
Analysis:
Market Structure:
The chart shows a clear bullish trend leading up to the current trading range.
A Break of Structure (B.O.S) is identified, indicating a significant move upward.
Key Levels:
Asia High (Close): This level marks the highest point reached during the Asian trading
session.
Asia Low (Close): The lowest point during the Asian session.
London High (Open): The high point at the opening of the London session.
London Low (Open): The low point at the opening of the London session.
Change of Character (ChoCh):
The ChoCh indicates a potential shift in market sentiment or a possible reversal point.
Trade Setup:
The chart suggests a potential short position based on the current price action.
Entry is marked just below the London High (Open) level.
Stop Loss is placed above the recent high, near the Asia High (Close).
Take Profit is projected at the possible fill of imbalance around the 40,400.00 level, which is aligned with previous support/resistance levels.
Risk Management:
The red box represents the risk area for the trade, indicating the stop-loss range.
The green box shows the potential reward area, indicating the take-profit target.
Additional Observations:
The trade aims to capitalize on a potential retracement or correction after the recent bullish run.
Monitoring the price action around the marked levels is crucial to validate the trade setup.
Disclaimer
The information and publications are not meant to be, and do not constitute, financial, investment, trading, or other types of advice or recommendations supplied or endorsed by TradingView. Read more in the Terms of Use.
Disclaimer
The information and publications are not meant to be, and do not constitute, financial, investment, trading, or other types of advice or recommendations supplied or endorsed by TradingView. Read more in the Terms of Use.