Short
Symmetrical triangle: SPX
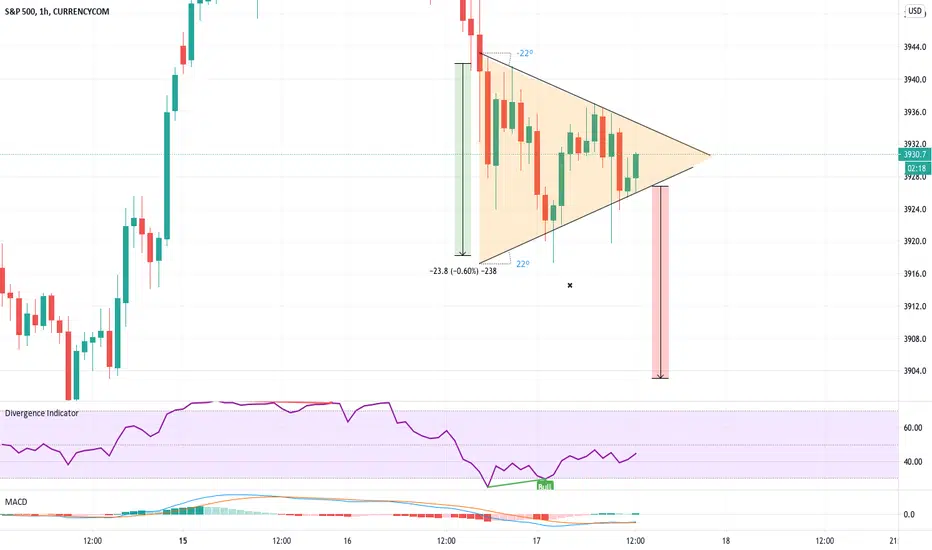
SPX is in a Symmetrical triangle, which is a bilateral pattern that might break out to the upside or the downside. However, SPX is under a heavy bearish pressure, that is confirmed after being unable to make higher highs once it broke out of the falling wedge, it merely reached a weak resistance and bounced back.So, My guess is that this symmetrical triangle is the bearish variant singling a continuation to the downside momentum. :)
Related publications
Disclaimer
The information and publications are not meant to be, and do not constitute, financial, investment, trading, or other types of advice or recommendations supplied or endorsed by TradingView. Read more in the Terms of Use.
Related publications
Disclaimer
The information and publications are not meant to be, and do not constitute, financial, investment, trading, or other types of advice or recommendations supplied or endorsed by TradingView. Read more in the Terms of Use.