So far in July, the US 500 has recorded multiple all-time highs on its way to an eventual peak of 6294 on Thursday (July 10th), from which it finally succumbed to some profit taking into the weekend, leading to a small Friday sell off to close at 6255 (-0.4%).
Along the way traders have ignored mixed US economic data, and more importantly they have, for the most part, shrugged off President Trump’s increasingly aggressive approach to tariffs, choosing instead to focus on economic resilience, renewed AI optimism and an improving outlook for the Q2 corporate earnings season that kicks fully into gear in the coming days.
In terms of tariffs, the fact that there is now a new August 1st deadline to concentrate on may be taking away some of the immediate urgency for the announcement of trade deals, although these issues still remain important and on-going, highlighted by President Trump's weekend social media announcement of 30% tariffs on the EU and Mexico, if a better deal cant be reached in the next 3 weeks.
With regard to corporate earnings, the major US banks like JP Morgan (Tuesday before the open) and Bank of America (Wednesday before the open) report this week. Both company’s share prices have seen strong gains since the April lows, so traders will be eagerly awaiting their actual numbers. They will also be keen to hear the thoughts of the bank CEOs on future earnings, bad debt provisions and the potential impact of Trump’s tariffs on the US economy moving forward. Only last week, Jamie Dimon, CEO of JP Morgan, warned market complacency towards potential tariff risks.
In terms of scheduled economic data. Tuesday’s US CPI (1330 BST) and Wednesday’s PPI release (1330 BST) stand out. Traders are sensitive to US inflation updates and have been watching over the last several months for signs that tariffs are pushing up prices. So far this hasn’t been the case but these new releases may tell a different story.
All of these issues could impact risk sentiment and the direction of the US 500 index in the next 5 trading days. Certainly, the early open has been impacted by President Trump's weekend tariff announcement, with the US 500 currently down 0.46% at 6227 (0800 BST).
The technical outlook could also be an important factor in determining price moves.
Technical Update: Assessing the Move to A New Record High
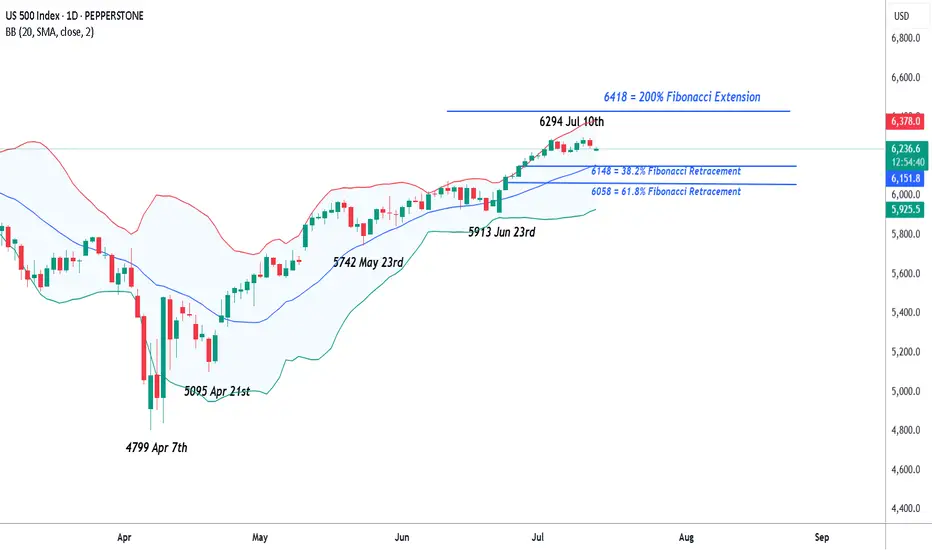
Last week appears to have seen a slowing in the speed of the recent price strength, but a new all-time high was still posted at 6294 on Thursday. It could be argued that this activity maintains what is still a more constructive pattern of higher price highs and higher price lows that have materialised since the April 7th downside extreme of 4799.

However, there is no guarantee this price activity will continue to see new all-time highs posted, so we need to be aware of potential support and resistance levels that may influence price activity.
Possible Support Levels:
If last week’s possible slowing in upside price momentum develops into a new phase of price weakness, a support level that traders might now be watching could be 6148.
This 6148 level is equal to both the 38.2% Fibonacci retracement of June 23rd to July 10th strength and the current level of the rising Bollinger mid-average. Closes below 6148 might suggest a more extended phase of weakness back to 6058, the lower 61.8% Fibonacci retracement, possibly further if this in turn gives way.
Possible Resistance Levels:
Having been capped by the 6294 all-time high last week, sellers may continue to be found at this level, so this might prove to be the first potential resistance if fresh attempts at price strength over the coming week develop.
Closing defence of 6294 may need to be watched if challenged, as successful breaks above this level might suggest an extension of the uptrend pattern currently evident in price activity. Such closing breaks higher may well suggest price strength towards 6418, the 200% Fibonacci extension level of the recent price decline.
The material provided here has not been prepared accordance with legal requirements designed to promote the independence of investment research and as such is considered to be a marketing communication. Whilst it is not subject to any prohibition on dealing ahead of the dissemination of investment research, we will not seek to take any advantage before providing it to our clients.
Pepperstone doesn’t represent that the material provided here is accurate, current or complete, and therefore shouldn’t be relied upon as such. The information, whether from a third party or not, isn’t to be considered as a recommendation; or an offer to buy or sell; or the solicitation of an offer to buy or sell any security, financial product or instrument; or to participate in any particular trading strategy. It does not take into account readers’ financial situation or investment objectives. We advise any readers of this content to seek their own advice. Without the approval of Pepperstone, reproduction or redistribution of this information isn’t permitted.
Along the way traders have ignored mixed US economic data, and more importantly they have, for the most part, shrugged off President Trump’s increasingly aggressive approach to tariffs, choosing instead to focus on economic resilience, renewed AI optimism and an improving outlook for the Q2 corporate earnings season that kicks fully into gear in the coming days.
In terms of tariffs, the fact that there is now a new August 1st deadline to concentrate on may be taking away some of the immediate urgency for the announcement of trade deals, although these issues still remain important and on-going, highlighted by President Trump's weekend social media announcement of 30% tariffs on the EU and Mexico, if a better deal cant be reached in the next 3 weeks.
With regard to corporate earnings, the major US banks like JP Morgan (Tuesday before the open) and Bank of America (Wednesday before the open) report this week. Both company’s share prices have seen strong gains since the April lows, so traders will be eagerly awaiting their actual numbers. They will also be keen to hear the thoughts of the bank CEOs on future earnings, bad debt provisions and the potential impact of Trump’s tariffs on the US economy moving forward. Only last week, Jamie Dimon, CEO of JP Morgan, warned market complacency towards potential tariff risks.
In terms of scheduled economic data. Tuesday’s US CPI (1330 BST) and Wednesday’s PPI release (1330 BST) stand out. Traders are sensitive to US inflation updates and have been watching over the last several months for signs that tariffs are pushing up prices. So far this hasn’t been the case but these new releases may tell a different story.
All of these issues could impact risk sentiment and the direction of the US 500 index in the next 5 trading days. Certainly, the early open has been impacted by President Trump's weekend tariff announcement, with the US 500 currently down 0.46% at 6227 (0800 BST).
The technical outlook could also be an important factor in determining price moves.
Technical Update: Assessing the Move to A New Record High
Last week appears to have seen a slowing in the speed of the recent price strength, but a new all-time high was still posted at 6294 on Thursday. It could be argued that this activity maintains what is still a more constructive pattern of higher price highs and higher price lows that have materialised since the April 7th downside extreme of 4799.
However, there is no guarantee this price activity will continue to see new all-time highs posted, so we need to be aware of potential support and resistance levels that may influence price activity.
Possible Support Levels:
If last week’s possible slowing in upside price momentum develops into a new phase of price weakness, a support level that traders might now be watching could be 6148.
This 6148 level is equal to both the 38.2% Fibonacci retracement of June 23rd to July 10th strength and the current level of the rising Bollinger mid-average. Closes below 6148 might suggest a more extended phase of weakness back to 6058, the lower 61.8% Fibonacci retracement, possibly further if this in turn gives way.
Possible Resistance Levels:
Having been capped by the 6294 all-time high last week, sellers may continue to be found at this level, so this might prove to be the first potential resistance if fresh attempts at price strength over the coming week develop.
Closing defence of 6294 may need to be watched if challenged, as successful breaks above this level might suggest an extension of the uptrend pattern currently evident in price activity. Such closing breaks higher may well suggest price strength towards 6418, the 200% Fibonacci extension level of the recent price decline.
The material provided here has not been prepared accordance with legal requirements designed to promote the independence of investment research and as such is considered to be a marketing communication. Whilst it is not subject to any prohibition on dealing ahead of the dissemination of investment research, we will not seek to take any advantage before providing it to our clients.
Pepperstone doesn’t represent that the material provided here is accurate, current or complete, and therefore shouldn’t be relied upon as such. The information, whether from a third party or not, isn’t to be considered as a recommendation; or an offer to buy or sell; or the solicitation of an offer to buy or sell any security, financial product or instrument; or to participate in any particular trading strategy. It does not take into account readers’ financial situation or investment objectives. We advise any readers of this content to seek their own advice. Without the approval of Pepperstone, reproduction or redistribution of this information isn’t permitted.
Global risk Warning CFDs are complex instruments and come with a high risk of losing money rapidly due to leverage. Between 74-89% of retail investor accounts lose money when trading in CFDs. You should consider whether you understand how CFD
Disclaimer
The information and publications are not meant to be, and do not constitute, financial, investment, trading, or other types of advice or recommendations supplied or endorsed by TradingView. Read more in the Terms of Use.