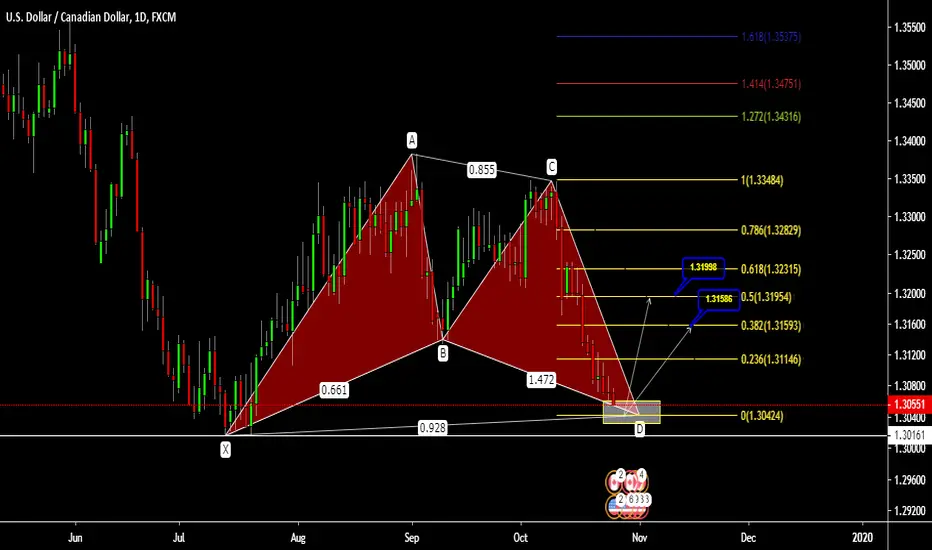
Caution should be taken as price is getting close to the drop of $1.30161 or below. On the daily time frame chart, the price of USDCAD has moved down after forming a double top chart pattern and at the same time formed a bullish chart pattern called the bullish gartley pattern. This has to do with a lot of fibonacci calculations, below are the process to be taken(still the same process):
XA - Price rises from X to peak at A. This is typically a large upward move to accommodate the retraces that follow.
AB - Price retraces from the peak A to valley B about 61.8% of the XA move.
BC - After bottoming at B, price climbs to C. The BC move retraces 61.8% or 78.6% of the AB drop.
CD - The final leg of the pattern sees price drop from peak C to the valley at D. The CD move is 127% or 161.8% of the BC move.
NOTE: This pattern should be ignored if price drops below X on the way to finding D.
Levels back to the up side should start with a reversal from:
Reversal breakout price: 1.30727
Resistance 1:1.31162
Resistance 2: 1.31586
Resistance 3: 1.31998
Good luck to everyone! Click the follow button to stay tuned for more trading ideas! Like the idea? Hit the like button!
Ideas published should not be referred to as an investment advice.
Disclaimer
The information and publications are not meant to be, and do not constitute, financial, investment, trading, or other types of advice or recommendations supplied or endorsed by TradingView. Read more in the Terms of Use.
Disclaimer
The information and publications are not meant to be, and do not constitute, financial, investment, trading, or other types of advice or recommendations supplied or endorsed by TradingView. Read more in the Terms of Use.