tradingview.com/chart/oMF0sdyu/?symbol=OANDA:USDCAD
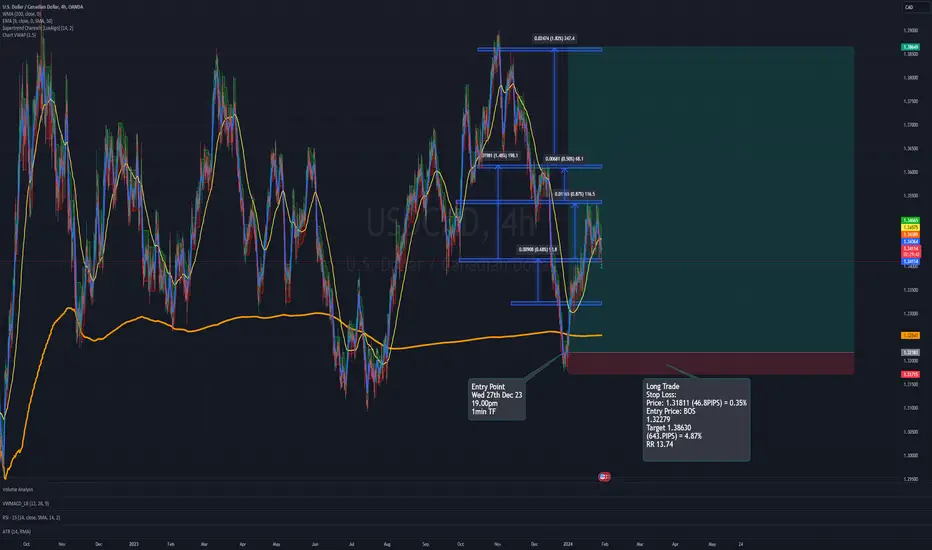
Observe the demand level and Breakout of Support (BOS) at new demand level. I anticpate assumed levels of 1.33265 to 1.33798 for a potential retest of this zone. Once identified, consider entering the market from the pullback or retracement.
Continuation of trade since Dec 2023
Observe the demand level and Breakout of Support (BOS) at new demand level. I anticpate assumed levels of 1.33265 to 1.33798 for a potential retest of this zone. Once identified, consider entering the market from the pullback or retracement.
Continuation of trade since Dec 2023
Note
1.34033 good support level for this event...?Note
1.33783 and not 1.33265 (Error)Trade active
Observation2nd February 2024
5:00 PM
A new demand level was validated with buyers in control, driving the market to the upside from 1:00 PM onwards. This development aligns with a previously noted and predicted entry level - the previous OTZ assumed entry level at 1.33798, which was identified on the 29th January for a potential retest of this zone. Once identified, consider entering the market from the pullback or retracement.
Trade active
Level 1.37280 (reached) 11th april 24
Observed 15.00pm
London/New York Session
Trade duration approx (3 months)
Disclaimer
The information and publications are not meant to be, and do not constitute, financial, investment, trading, or other types of advice or recommendations supplied or endorsed by TradingView. Read more in the Terms of Use.
Disclaimer
The information and publications are not meant to be, and do not constitute, financial, investment, trading, or other types of advice or recommendations supplied or endorsed by TradingView. Read more in the Terms of Use.
