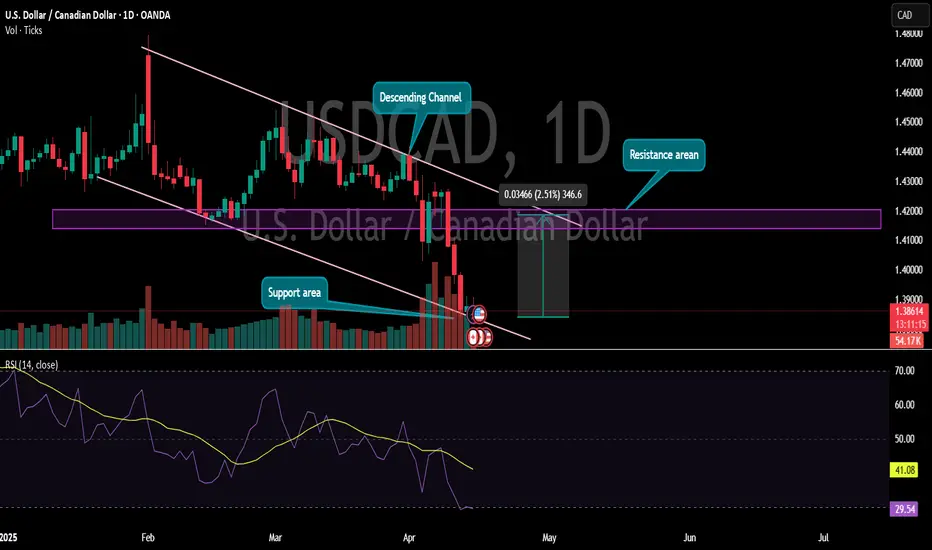
📉 Overall Structure: Descending Channel
The price is moving within a clearly defined descending channel, indicating a downtrend.
Price is respecting both upper and lower boundaries of the channel, confirming strong bearish momentum.
📍 Key Levels:
🔻 Support Area (~1.3740–1.3800)
Price is currently hovering near the bottom boundary of the channel and just above a marked support zone.
Historically, this zone has triggered bullish reactions, making it a key level to watch for a potential bounce or reversal.
🔺 Resistance Area (~1.4150–1.4200)
Marked in purple, this zone aligns with previous swing highs and structure, making it a significant resistance level.
If price bounces from the current support, this is the first target area to watch.
📊 Volume
Notice the increased red volume bars as the price moved lower – this confirms strong selling pressure.
However, the recent candle shows a smaller body with lower volume, hinting at a potential exhaustion of sellers.
📉 RSI (Relative Strength Index) – Oversold
RSI is at 29.47, which is below the 30 level – indicating the pair is oversold.
When RSI dips this low, it often precedes a bounce or temporary bullish correction, especially if price is at a key support (which it is).
✅ Trade Idea / Potential Setup
Bullish Reversal Setup Possible:
The confluence of:
Oversold RSI,
Major support,
Bottom of the descending channel,
makes this a potential area for a long (buy) position.
Target: Resistance area around 1.4150–1.4200 (2.5% gain).
Stop-loss: Below the channel/support zone to limit risk.
🧠 Summary:
USDCAD is in a downtrend but currently testing a major support area at the channel bottom.
RSI is oversold, suggesting limited downside.
Look for bullish confirmation (e.g., bullish engulfing candle or a break of short-term structure) before entering long.
Disclaimer
The information and publications are not meant to be, and do not constitute, financial, investment, trading, or other types of advice or recommendations supplied or endorsed by TradingView. Read more in the Terms of Use.
Disclaimer
The information and publications are not meant to be, and do not constitute, financial, investment, trading, or other types of advice or recommendations supplied or endorsed by TradingView. Read more in the Terms of Use.