Over the past four trading sessions, the USD/CHF pair has appreciated by nearly 0.5%, as a new bullish bias has begun to consolidate on the daily chart. For now, buying pressure remains steady, supported by the recovery of the U.S. dollar, which started gaining strength shortly after it was revealed that the year-over-year CPI in the U.S. came in at 2.7%, above the 2.6% expected. This outcome may lead the Federal Reserve to adopt a more hawkish tone, and if elevated interest rates persist, it’s likely that demand for the dollar will continue to strengthen in the short term.
Downtrend Still in Place
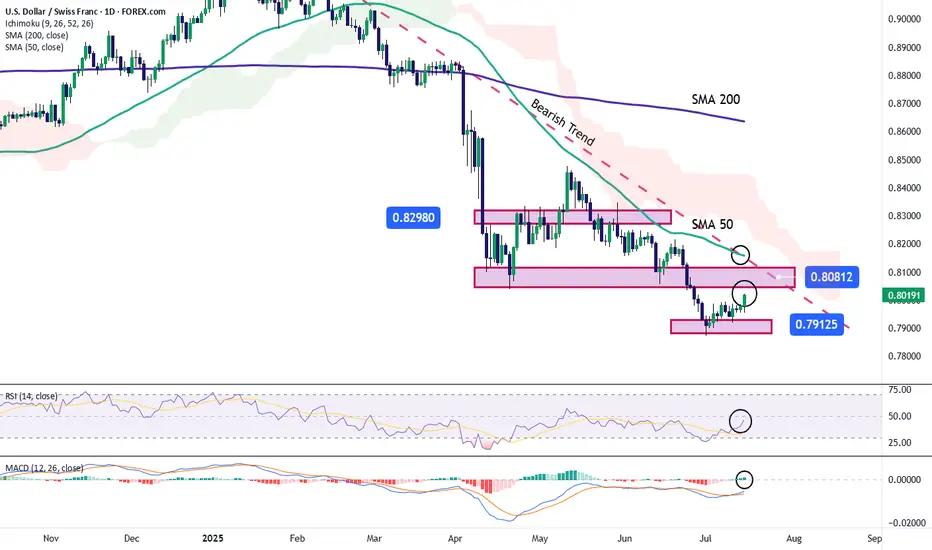
The recent bearish movements have kept the pair within a steady downward trend in the short term. However, a relevant bullish correction is now emerging, and if it continues, it could put the current bearish structure at risk. As price continues to test resistance levels, buying pressure may become increasingly relevant.
Technical Indicators:
RSI: The RSI line is showing clear bullish behavior, with a sustained upward slope in the short term. It is currently approaching the neutral 50 level, and a breakout above that could signal bullish momentum dominance, reinforcing the current upward pressure.
MACD: The MACD histogram shows consistent bullish momentum, remaining above the neutral zero line. This suggests that moving average strength remains in bullish territory, and if the histogram continues to move away from the neutral axis, it could confirm stronger buying pressure in the short term.
Key Levels to Watch:
Written by Julian Pineda, CFA – Market Analyst
Downtrend Still in Place
The recent bearish movements have kept the pair within a steady downward trend in the short term. However, a relevant bullish correction is now emerging, and if it continues, it could put the current bearish structure at risk. As price continues to test resistance levels, buying pressure may become increasingly relevant.
Technical Indicators:
RSI: The RSI line is showing clear bullish behavior, with a sustained upward slope in the short term. It is currently approaching the neutral 50 level, and a breakout above that could signal bullish momentum dominance, reinforcing the current upward pressure.
MACD: The MACD histogram shows consistent bullish momentum, remaining above the neutral zero line. This suggests that moving average strength remains in bullish territory, and if the histogram continues to move away from the neutral axis, it could confirm stronger buying pressure in the short term.
Key Levels to Watch:
- 0.80812 – Immediate Resistance: This level aligns with the main descending trendline on the chart. Sustained movement above this zone could invalidate the current bearish structure and open the door to a more dominant bullish bias.
- 0.82980 – Distant Resistance: A zone that coincides with previous highs. If price consistently reaches this level, it could trigger the formation of a new bullish structure in the coming weeks.
- 0.79125 – Key Support: This level marks the recent weekly lows. A break below this zone could revive bearish momentum and potentially initiate a broader downward trend in the short term.
Written by Julian Pineda, CFA – Market Analyst
Disclaimer
The information and publications are not meant to be, and do not constitute, financial, investment, trading, or other types of advice or recommendations supplied or endorsed by TradingView. Read more in the Terms of Use.
Disclaimer
The information and publications are not meant to be, and do not constitute, financial, investment, trading, or other types of advice or recommendations supplied or endorsed by TradingView. Read more in the Terms of Use.