0721 Impact of Japanese Senate Elections on Yen Exchange Rate
Hello traders,
1. I spent the entire weekend following the Japanese Senate elections, as they will determine the fluctuations of the world's largest financing currency—the yen exchange rate.
★ The results are out, and we are currently in scenario two— the ruling coalition suffered a crushing defeat + Shigeru Ishiba refuses to resign. However, senior figures within the Liberal Democratic Party, such as Taro Aso, have publicly stated that they intend to demand Prime Minister Ishiba's resignation for accountability, increasing the pressure on Ishiba to step down. This means we might see "scenario three"—the USD/JPY exchange rate could potentially break through the 151-155 range.
★ Is this the worst-case scenario? Of course not. The worst-case scenario would be if the "far-right party" that campaigned on the slogan "Japan First" achieved a landslide victory in this election. The most notable winner is a marginal far-right party known as the "Reform Party."
The Reform Party originated from a YouTube channel during the pandemic, which spread conspiracy theories about vaccines and "global elite conspiracies." NHK estimates that the Reform Party will win up to 22 seats, whereas three years ago, they had only 1 seat in the Senate and currently have only 3 seats in the House of Representatives.
✔ Let's take a look at this big winner's political proposals—stricter immigration restrictions + opposition to globalism + opposition to radical gender policies + reassessment of decarbonization and vaccine policies + massive tax cuts + increased social welfare spending. This means Japan may implement more "radical tax cuts" combined with aggressive economic stimulus through quantitative easing, leading to a more severe depreciation of the yen, increasing the likelihood of the USD/JPY exchange rate rising to the 160 range.
★ What are the risks of a sharp depreciation of the yen?
For Asia, the depreciation of the yen typically drags down other Asian currencies collectively, especially under U.S. tariff pressures, where Asian currencies are already under devaluation pressure. A strong depreciation of the yen would mean Japan is taking other Asian countries along with it off a cliff. We need to pay attention to the "passive" depreciation of the renminbi.
Asia will feel the pain, but Europe and the U.S. will also suffer. Theoretically, if the USD/JPY exchange rate surges (indicating a sharp depreciation of the yen), it is very advantageous for arbitrage trading with leverage (because the yen becomes cheaper). However, when the yen experiences a severe depreciation, the situation changes.
Let me give you a classic example: After Shinzo Abe returned to power at the end of 2012, he launched the "three arrows" economic policy: unlimited quantitative easing monetary policy + fiscal stimulus + structural reform = artificially lowering the yen exchange rate to stimulate exports (the clear goal was to increase the USD/JPY exchange rate) = rapid depreciation of the yen (from 80 in 2012 to 125 in 2015).
So what happened then? — A large number of Japanese institutions sold off U.S. bonds, European bonds, and REITs to cash out. The reason is simple:
✔ Japanese financial institutions (such as GPIF, insurance companies, and banks) hold a large amount of dollar/euro assets. When the yen depreciates, the yen-denominated market value of these foreign currency assets skyrockets. Selling off overseas assets is equivalent to cashing out foreign exchange gains in advance.
✔ The proportion of foreign currency assets is too high → must rebalance. Due to the yen depreciation, a large institution that originally allocated 20% of its total assets to foreign currency assets might see that proportion swell to 30% or 40%. This triggers asset allocation restrictions within pension and insurance funds (ALM principles), necessitating the sale of overseas assets and reallocation to yen-denominated assets.
✔ The yen depreciation phase is usually accompanied by an expansion of the U.S.-Japan interest rate differential. If Japanese institutions hedge their dollar assets, the hedging costs become very high (the costs of hedging through FX swaps and forwards rise), so they must also sell off some assets to reduce exposure. Therefore, in 2013, there was a collective sell-off of U.S. and European bonds.
Technically:
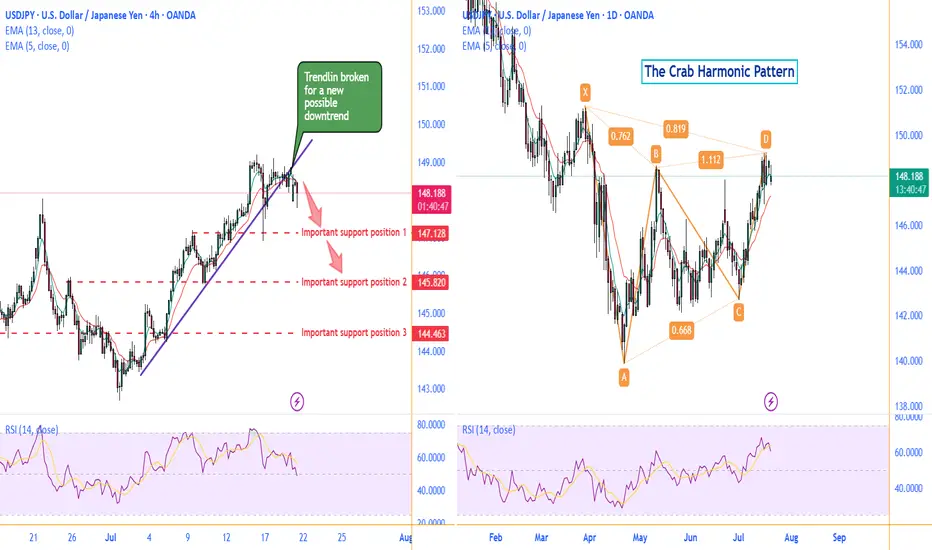
Daily chart, there is a possible Crab Harmonic Pattern.
The Crab Harmonic Pattern
From the chart, we can see:
The upward move from A to B is labeled as 0.762, which falls within the Fibonacci ratio range of 0.618-0.786 for the A-B leg of the Crab pattern.
The downward move from B to C is labeled as 0.668, which also falls within the Fibonacci ratio range of 0.382-0.886 for the B-C leg of the Crab pattern.
The upward move from C to D is labeled as 1.112, which corresponds to the Fibonacci ratio range of 1.13-1.272 for the C-D leg of the Crab pattern.
Based on these Fibonacci ratio relationships, we can identify this price action pattern as a typical Crab harmonic pattern. This type of pattern often suggests that the price may be about to reverse.
On the left 4H chart, the broken trendline is suggesting a new possible downtrend to begin .
Make a good use of those support positions, sellers of UJ could find a great trade deal.
Follow me to get more update on UJ.
GOOD LUCK!
LESS IS MORE!
1. I spent the entire weekend following the Japanese Senate elections, as they will determine the fluctuations of the world's largest financing currency—the yen exchange rate.
★ The results are out, and we are currently in scenario two— the ruling coalition suffered a crushing defeat + Shigeru Ishiba refuses to resign. However, senior figures within the Liberal Democratic Party, such as Taro Aso, have publicly stated that they intend to demand Prime Minister Ishiba's resignation for accountability, increasing the pressure on Ishiba to step down. This means we might see "scenario three"—the USD/JPY exchange rate could potentially break through the 151-155 range.
★ Is this the worst-case scenario? Of course not. The worst-case scenario would be if the "far-right party" that campaigned on the slogan "Japan First" achieved a landslide victory in this election. The most notable winner is a marginal far-right party known as the "Reform Party."
The Reform Party originated from a YouTube channel during the pandemic, which spread conspiracy theories about vaccines and "global elite conspiracies." NHK estimates that the Reform Party will win up to 22 seats, whereas three years ago, they had only 1 seat in the Senate and currently have only 3 seats in the House of Representatives.
✔ Let's take a look at this big winner's political proposals—stricter immigration restrictions + opposition to globalism + opposition to radical gender policies + reassessment of decarbonization and vaccine policies + massive tax cuts + increased social welfare spending. This means Japan may implement more "radical tax cuts" combined with aggressive economic stimulus through quantitative easing, leading to a more severe depreciation of the yen, increasing the likelihood of the USD/JPY exchange rate rising to the 160 range.
★ What are the risks of a sharp depreciation of the yen?
For Asia, the depreciation of the yen typically drags down other Asian currencies collectively, especially under U.S. tariff pressures, where Asian currencies are already under devaluation pressure. A strong depreciation of the yen would mean Japan is taking other Asian countries along with it off a cliff. We need to pay attention to the "passive" depreciation of the renminbi.
Asia will feel the pain, but Europe and the U.S. will also suffer. Theoretically, if the USD/JPY exchange rate surges (indicating a sharp depreciation of the yen), it is very advantageous for arbitrage trading with leverage (because the yen becomes cheaper). However, when the yen experiences a severe depreciation, the situation changes.
Let me give you a classic example: After Shinzo Abe returned to power at the end of 2012, he launched the "three arrows" economic policy: unlimited quantitative easing monetary policy + fiscal stimulus + structural reform = artificially lowering the yen exchange rate to stimulate exports (the clear goal was to increase the USD/JPY exchange rate) = rapid depreciation of the yen (from 80 in 2012 to 125 in 2015).
So what happened then? — A large number of Japanese institutions sold off U.S. bonds, European bonds, and REITs to cash out. The reason is simple:
✔ Japanese financial institutions (such as GPIF, insurance companies, and banks) hold a large amount of dollar/euro assets. When the yen depreciates, the yen-denominated market value of these foreign currency assets skyrockets. Selling off overseas assets is equivalent to cashing out foreign exchange gains in advance.
✔ The proportion of foreign currency assets is too high → must rebalance. Due to the yen depreciation, a large institution that originally allocated 20% of its total assets to foreign currency assets might see that proportion swell to 30% or 40%. This triggers asset allocation restrictions within pension and insurance funds (ALM principles), necessitating the sale of overseas assets and reallocation to yen-denominated assets.
✔ The yen depreciation phase is usually accompanied by an expansion of the U.S.-Japan interest rate differential. If Japanese institutions hedge their dollar assets, the hedging costs become very high (the costs of hedging through FX swaps and forwards rise), so they must also sell off some assets to reduce exposure. Therefore, in 2013, there was a collective sell-off of U.S. and European bonds.
Technically:
Daily chart, there is a possible Crab Harmonic Pattern.
The Crab Harmonic Pattern
From the chart, we can see:
The upward move from A to B is labeled as 0.762, which falls within the Fibonacci ratio range of 0.618-0.786 for the A-B leg of the Crab pattern.
The downward move from B to C is labeled as 0.668, which also falls within the Fibonacci ratio range of 0.382-0.886 for the B-C leg of the Crab pattern.
The upward move from C to D is labeled as 1.112, which corresponds to the Fibonacci ratio range of 1.13-1.272 for the C-D leg of the Crab pattern.
Based on these Fibonacci ratio relationships, we can identify this price action pattern as a typical Crab harmonic pattern. This type of pattern often suggests that the price may be about to reverse.
On the left 4H chart, the broken trendline is suggesting a new possible downtrend to begin .
Make a good use of those support positions, sellers of UJ could find a great trade deal.
Follow me to get more update on UJ.
GOOD LUCK!
LESS IS MORE!
Note
First target hit.Trade closed: target reached
2nd target hit on 24 JulyJoin Free Telegram Group to get MORE trading skills: t.me/FuntraderVera
Disclaimer
The information and publications are not meant to be, and do not constitute, financial, investment, trading, or other types of advice or recommendations supplied or endorsed by TradingView. Read more in the Terms of Use.
Join Free Telegram Group to get MORE trading skills: t.me/FuntraderVera
Disclaimer
The information and publications are not meant to be, and do not constitute, financial, investment, trading, or other types of advice or recommendations supplied or endorsed by TradingView. Read more in the Terms of Use.