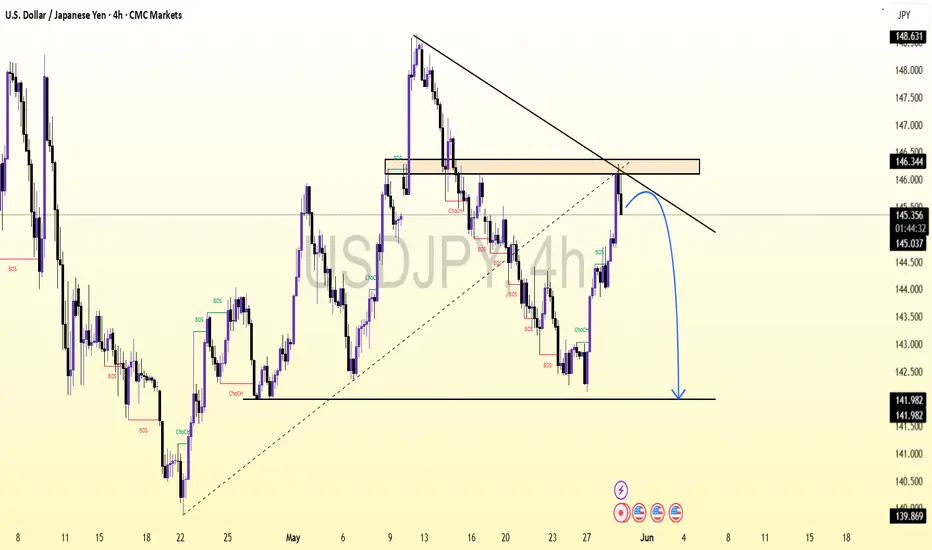
This USD/JPY 4H chart shows a bearish setup forming:
Key Resistance Zone around 146.3 has been respected multiple times.
Descending Trendline continues to cap price from above.
Price is currently testing this resistance zone again.
The chart suggests a possible rejection here, with a projected move down toward the 141.98 support level.
Bearish order blocks, Break of Structure (BoS), and **Change of Character (ChoCh) signals support a downside bias.
Overall, this analysis points to a potential short opportunity if price fails to break above the resistance and confirms reversal signs.
Trade closed: stop reached
Target almost hit JOIN MY TELEGRAM:
FREE SIGNALS TECHNICAL CHART AND EDUCATOIN
t.me/+j_sv6p9sL5I0MDY0
FREE SIGNALS TECHNICAL CHART AND EDUCATOIN
t.me/+j_sv6p9sL5I0MDY0
Disclaimer
The information and publications are not meant to be, and do not constitute, financial, investment, trading, or other types of advice or recommendations supplied or endorsed by TradingView. Read more in the Terms of Use.
JOIN MY TELEGRAM:
FREE SIGNALS TECHNICAL CHART AND EDUCATOIN
t.me/+j_sv6p9sL5I0MDY0
FREE SIGNALS TECHNICAL CHART AND EDUCATOIN
t.me/+j_sv6p9sL5I0MDY0
Disclaimer
The information and publications are not meant to be, and do not constitute, financial, investment, trading, or other types of advice or recommendations supplied or endorsed by TradingView. Read more in the Terms of Use.