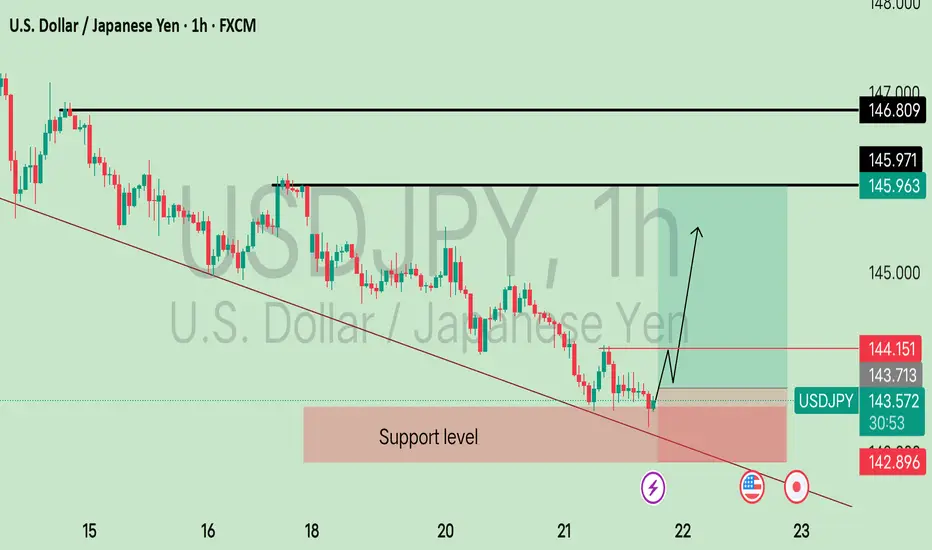
Currency Pair: USD/JPY
Timeframe: 1-hour (each candle represents one hour of price action)
Platform: TradingView
---
Key Elements Explained
1. Downtrend & Trendline
The red diagonal lines show a descending channel, meaning the price has been moving downward consistently.
The lower red trendline has acted as a support line, helping the price bounce back up.
2. Support Level
The shaded red area marked "Support level" shows a strong buying zone where the price has bounced up before.
The market reacted positively again after touching this zone.
3. Reversal & Trade Idea
A potential reversal is being predicted (price going up after touching the support level).
The black arrow suggests an expected upward movement.
---
Trade Setup (Marked on the Chart)
Entry: Around 143.556 (current market price)
Stop Loss (Red Box Bottom): Around 142.896 (below the support)
Take Profit (Green Box Top): Around 145.963 - 146.809
This is a long (buy) trade idea where the trader expects the price to go up after bouncing from the support.
Disclaimer
The information and publications are not meant to be, and do not constitute, financial, investment, trading, or other types of advice or recommendations supplied or endorsed by TradingView. Read more in the Terms of Use.
Disclaimer
The information and publications are not meant to be, and do not constitute, financial, investment, trading, or other types of advice or recommendations supplied or endorsed by TradingView. Read more in the Terms of Use.