USD/JPY Fake Breakout and Bearish Reversal Setup
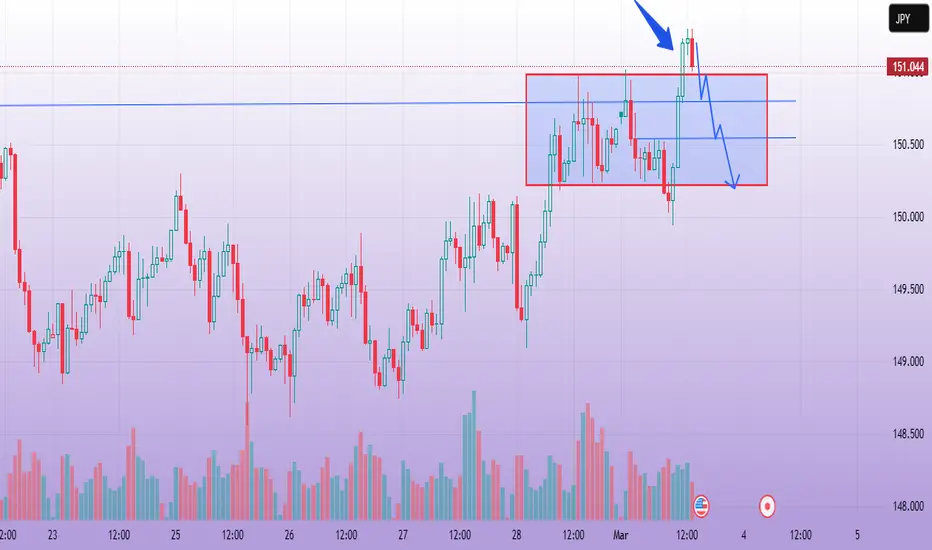
This is a technical analysis chart for USD/JPY, showing a potential bearish reversal after a breakout attempt.
Analysis:
Key Levels:
Resistance: Near 151.039 (recent high, indicated by the blue arrow).
Support: Around 150.500 and 150.000 (marked within the red consolidation box).
Market Structure:
The price was consolidating in a range (red box).
It broke out briefly above resistance, but the breakout appears weak.
The price is now falling back inside the range, indicating a fakeout.
Potential Trade Setup:
Bearish Bias: If the price fails to hold above 151.039, it may retest the lower range.
Target Levels:
First target: Around 150.500 (mid-range support).
Second target: Around 150.000 (lower support of the range).
Stop Loss (SL): Above 151.039, in case of another breakout attempt.
Volume Confirmation:
The volume spiked on the breakout, but the quick rejection suggests a lack of strong buying pressure.
If volume increases on the way down, it supports a bearish move.
Trading Bias:
Bearish short-term outlook due to fake breakout and rejection at resistance.
Expecting a move back into the range, potentially testing lower support levels.
Trade active
Resistance Level: 151.039 (failed breakout)Support Levels: 150.500 (mid-range) and 150.000 (lower range)
Market Structure: Price attempted to break resistance but got rejected, indicating a fakeout
Trade Bias: Bearish move expected back into the range
Target Levels:
JOIN OUR VIP TELEGRAM CHANNEL 👇
t.me/AK_GoldTradersignals
t.me/AK_GoldTradersignals
Related publications
Disclaimer
The information and publications are not meant to be, and do not constitute, financial, investment, trading, or other types of advice or recommendations supplied or endorsed by TradingView. Read more in the Terms of Use.