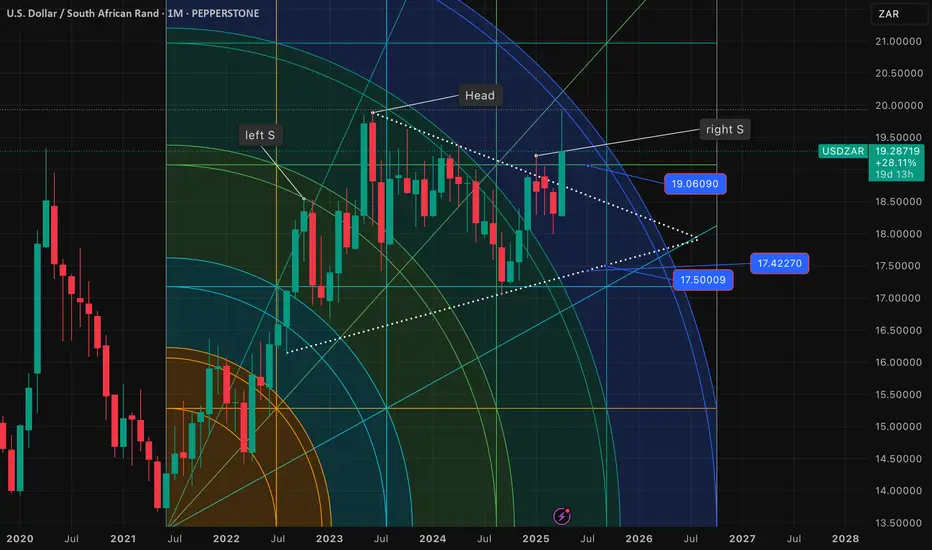
Some weeks back I had posted a monthly chart with a viewpoint of a likely S-H-S top formation, and that at that time the right shoulder still suggested we would see 19.3500 or more. Now we have formed this right shoulder pattern, and likely some more consolidation adding to the shoulder.
The overall view is long-term a larger decline to unfold and a break of the neck line (shown) may translate to 15.3000 objective roughly. so for those trading long-term, and have deep pockets, this may be an interesting pattern to look at.
The overall view is long-term a larger decline to unfold and a break of the neck line (shown) may translate to 15.3000 objective roughly. so for those trading long-term, and have deep pockets, this may be an interesting pattern to look at.
Disclaimer
The information and publications are not meant to be, and do not constitute, financial, investment, trading, or other types of advice or recommendations supplied or endorsed by TradingView. Read more in the Terms of Use.
Disclaimer
The information and publications are not meant to be, and do not constitute, financial, investment, trading, or other types of advice or recommendations supplied or endorsed by TradingView. Read more in the Terms of Use.