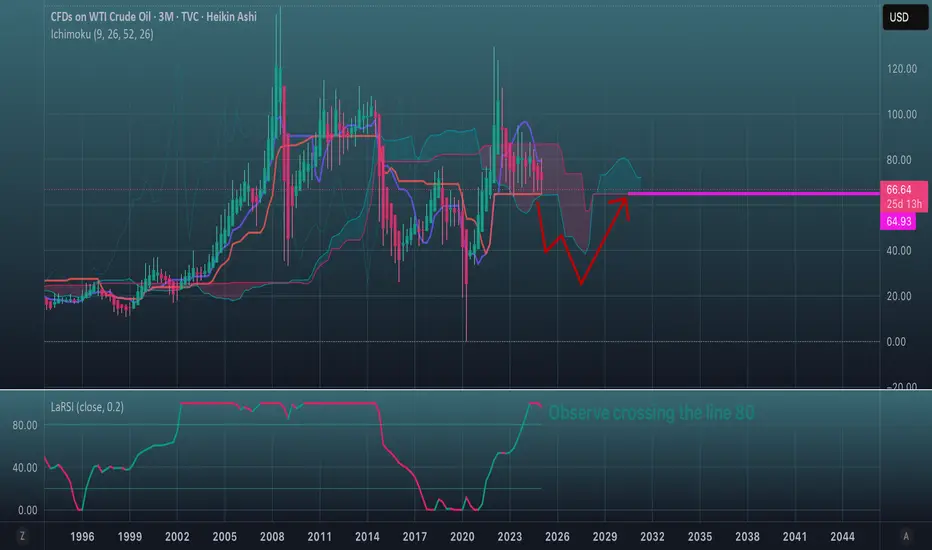
Three-month chart.
This is a situation on a very shaky edge.
The price has been crawling between the Kijun and Tenkan
lines for two years, the first of which works as resistance and the second as support.
A break of the ~$64.70 level could mean an exciting rally down to the ~$40 level first.
Speaking simply about the design of such an Ishimoku cloud, I would like to say.
we need to pay attention to the elongated cloud at the bottom. And now the price may
dive under it and fall into the $ 25-20 range for a while.
After that, it will start its recovery and it will again strive upwards to the level of $ 64.70.
So far, even Trump's statements have not broken the support.
But stand to drop the price out of the cloud, you will see a plunge to the depths.
Note
So far the wick is still above $54.54.
If the 3M candle closes with a break of this area
I believe the world will have the next three years
of oil prices not exceeding $54.54.
Disclaimer
The information and publications are not meant to be, and do not constitute, financial, investment, trading, or other types of advice or recommendations supplied or endorsed by TradingView. Read more in the Terms of Use.
Disclaimer
The information and publications are not meant to be, and do not constitute, financial, investment, trading, or other types of advice or recommendations supplied or endorsed by TradingView. Read more in the Terms of Use.