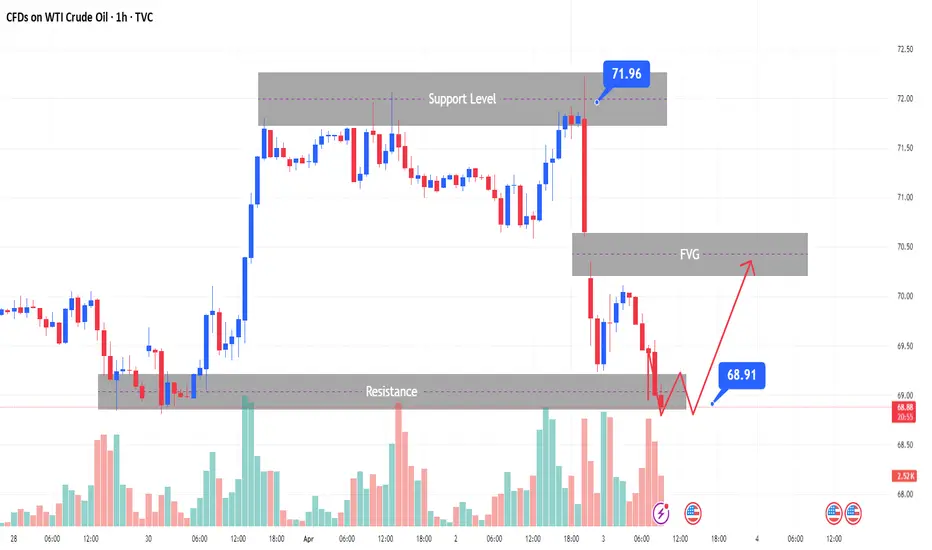
This chart shows the WTI Crude Oil (CL) on a 1-hour timeframe with key levels and potential trade setups based on the FVG (Fair Value Gap) and support and resistance zones. Here's a breakdown of the analysis:
Key Observations:
1. Support and Resistance Levels:
- Support Level: The price has recently tested the support level around 69.00. This area has acted as a bounce zone previously, which shows that buyers might be looking to enter the market here again.
- Resistance Level: The resistance level is around 71.50 to 72.00. This level was previously tested multiple times, and each time the price faced rejection from this level, making it a key area for potential price reversal.
2. Fair Value Gap (FVG):
- There is a Fair Value Gap (FVG) between 70.50 and 71.00. This gap represents a price imbalance where the market might eventually return to fill it. As the price is currently moving downwards, it suggests a potential retracement or reversal toward this gap in the near future.
3. Price Action:
- The price has recently shown a downward movement, breaking below the support zone at 69.00. After a sharp decline, there is a possibility of retracement towards the FVG area around 70.50.- Volume: The volume bars show significant buying pressure around the support zone, followed by decreasing volume during the price decline. This could indicate that the selling momentum is weakening, and a retracement towards the FVG area is likely.
Potential Scenarios:
1. Bullish Retracement Towards FVG:
- After the price dropped towards 69.00, it could now retrace towards the FVG gap around 70.50. The FVG gap might act as a resistance zone if the price attempts to fill it. If this happens, the price might face resistance at this gap level before turning downward again.
2. Bearish Continuation:
- If the price fails to hold above 69.00 and breaks further below this support level, it could continue to decline towards the next support zone below 68.50. This would invalidate the retracement scenario and suggest a bearish continuation.
3. Bullish Reversal from Support:
- If the price finds support at 69.00 and shows bullish price action (like a bullish engulfing candle or a strong green candle), a reversal could occur, and the price may start moving back toward the FVG gap. A break above the FVG gap could lead to a further rally toward the resistance zone around 71.50.
4. Target Completion:
👉Free Telegram Channel Link 👇
t.me/+o7AGmpIUIjM2YWM8
Vip Paid Signals Link 🔗
t.me/+o7AGmpIUIjM2YWM8
Recommend Best Broker Exness
Partner link 👇
one.exnesstrack.org/a/cpngkkjhvf
t.me/+o7AGmpIUIjM2YWM8
Vip Paid Signals Link 🔗
t.me/+o7AGmpIUIjM2YWM8
Recommend Best Broker Exness
Partner link 👇
one.exnesstrack.org/a/cpngkkjhvf
Disclaimer
The information and publications are not meant to be, and do not constitute, financial, investment, trading, or other types of advice or recommendations supplied or endorsed by TradingView. Read more in the Terms of Use.